Do you know what third places are?
If you don't know yet, a good way to answer this question is to start by thinking about where we spend most of our days. The first things that come to mind are probably our home and our workplace, and precisely, in urban studies, these two are called first and second places, respectively (the terms come from the sociologist Ray Oldenburg). So, what are third places? They are the spaces outside of home and work where people spend their time. They tend to be social (although socializing isn't really necessary), like parks, cafés, libraries, public squares, etc. They are spaces for leisure that let us socialize, feel like we belong in our community, and strengthen the social fabric.
It's no secret that communities with structural deficits and high marginalization also lack effective third places, where people are not only welcome but also don't need to spend money to spend time. That's why city governments around the world have invested in community centers where people can go to exercise, learn new skills, talk, have fun, or simply get together and be. Personally, my first contact (even if, for now, only a virtual one) with a big investment from a city to create third places and improve access to them for its whole population were the Library Parks (Parques Biblioteca) and the Articulated Life Units (Unidades de Vida Articulada) in Medellín (I really want to go see them in person!). With these investments, Medellín looks to give mainly marginalized populations access to sports and cultural services, and also to destigmatize neighborhoods and give them new life, as happened in Comuna 13.
In Mexico, specifically in Mexico City, we haven't stayed behind in this kind of social investment. You have probably heard of the PILARES (Points of Innovation, Freedom, Art, Education, and Knowledge) or the FAROS (Factories of Arts and Trades), and I'm sure you've heard of some event at the Faro de Oriente. These two are huge programs focused on access to arts and vocational education, computer literacy, sports areas, and cultural events. Even older than the FAROS, which started around the year 2000, we have a large number of Casas de Cultura (community cultural centers) spread all over the city. I learned to play the guitar at the Casa de Cultura "Raúl Anguiano", inside the Huayamilpas Ecological Park, so I know firsthand how important these kinds of centers are.
All of these options are mostly small in scale and local in reach, although the FAROS tend to be a bit bigger. To go one step further, in 2019, under Clara Brugada's government in the borough of Iztapalapa, the UTOPÍAS (Units of Transformation and Organization for Inclusion and Social Harmony) were born, with the idea of creating third places that offer not only sports and classes, but also a focus on overall well-being, with medical and psychological care, community kitchens, and even laundry areas. Today, with Brugada as Mayor of Mexico City, UTOPÍAS are being built in other parts of the city. When I visited the UTOPÍA "Elena Poniatowska Amor" in Coyoacán, what caught my attention the most were the urban gardens, the pollinator gardens, the 3D printing design classes (with direct access to the printers!), the language and knowledge labs, and a space they hadn't defined yet, but that looked very interesting, about virtual reality.
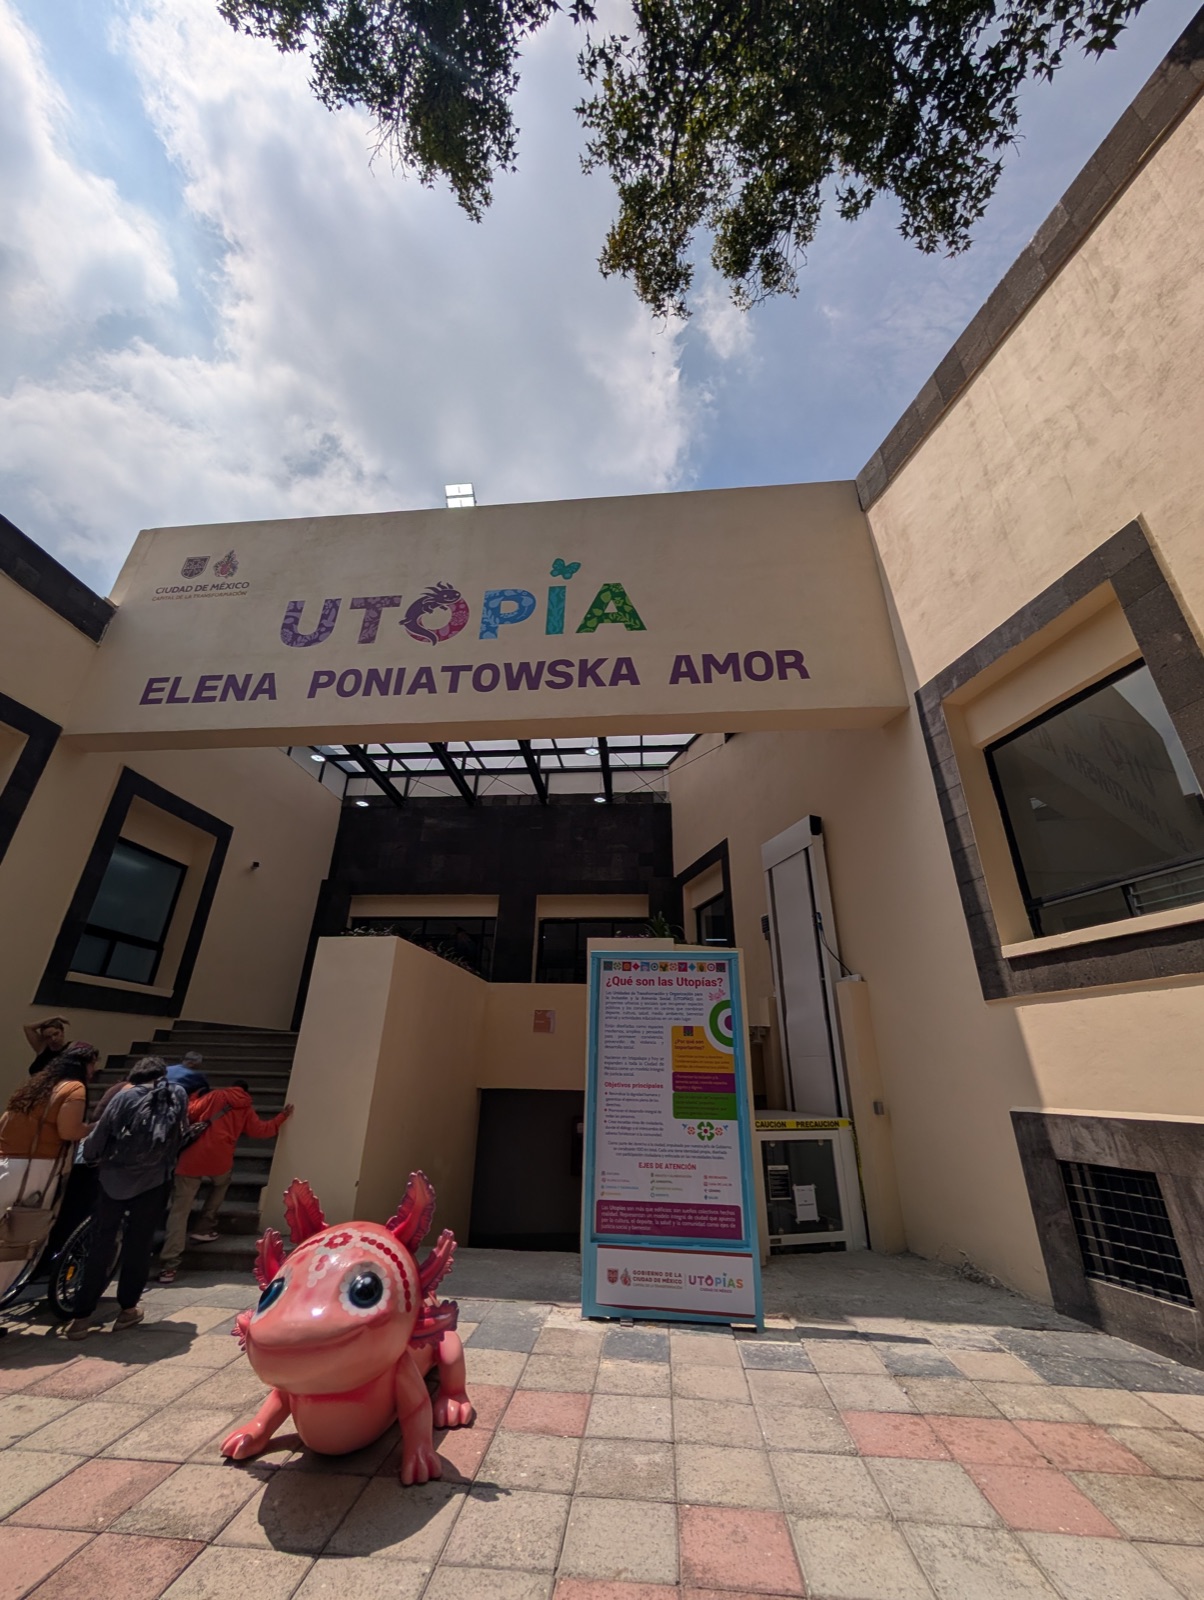
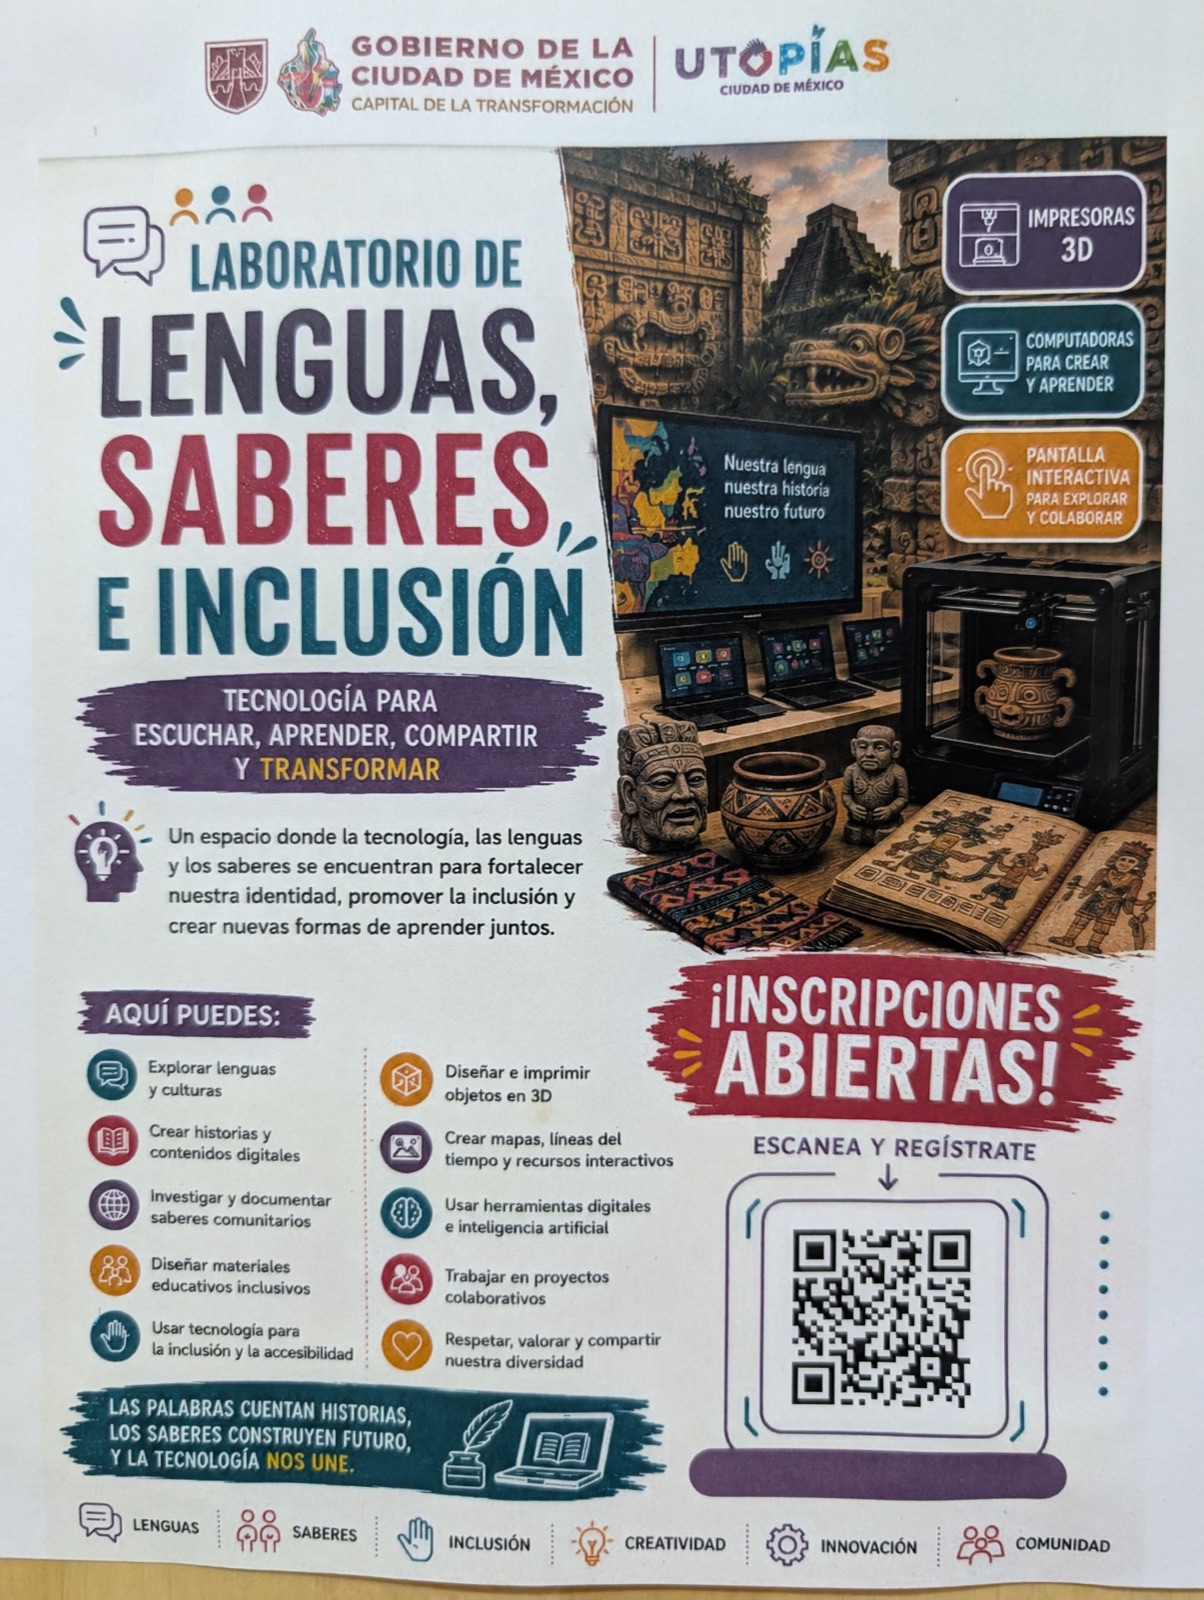
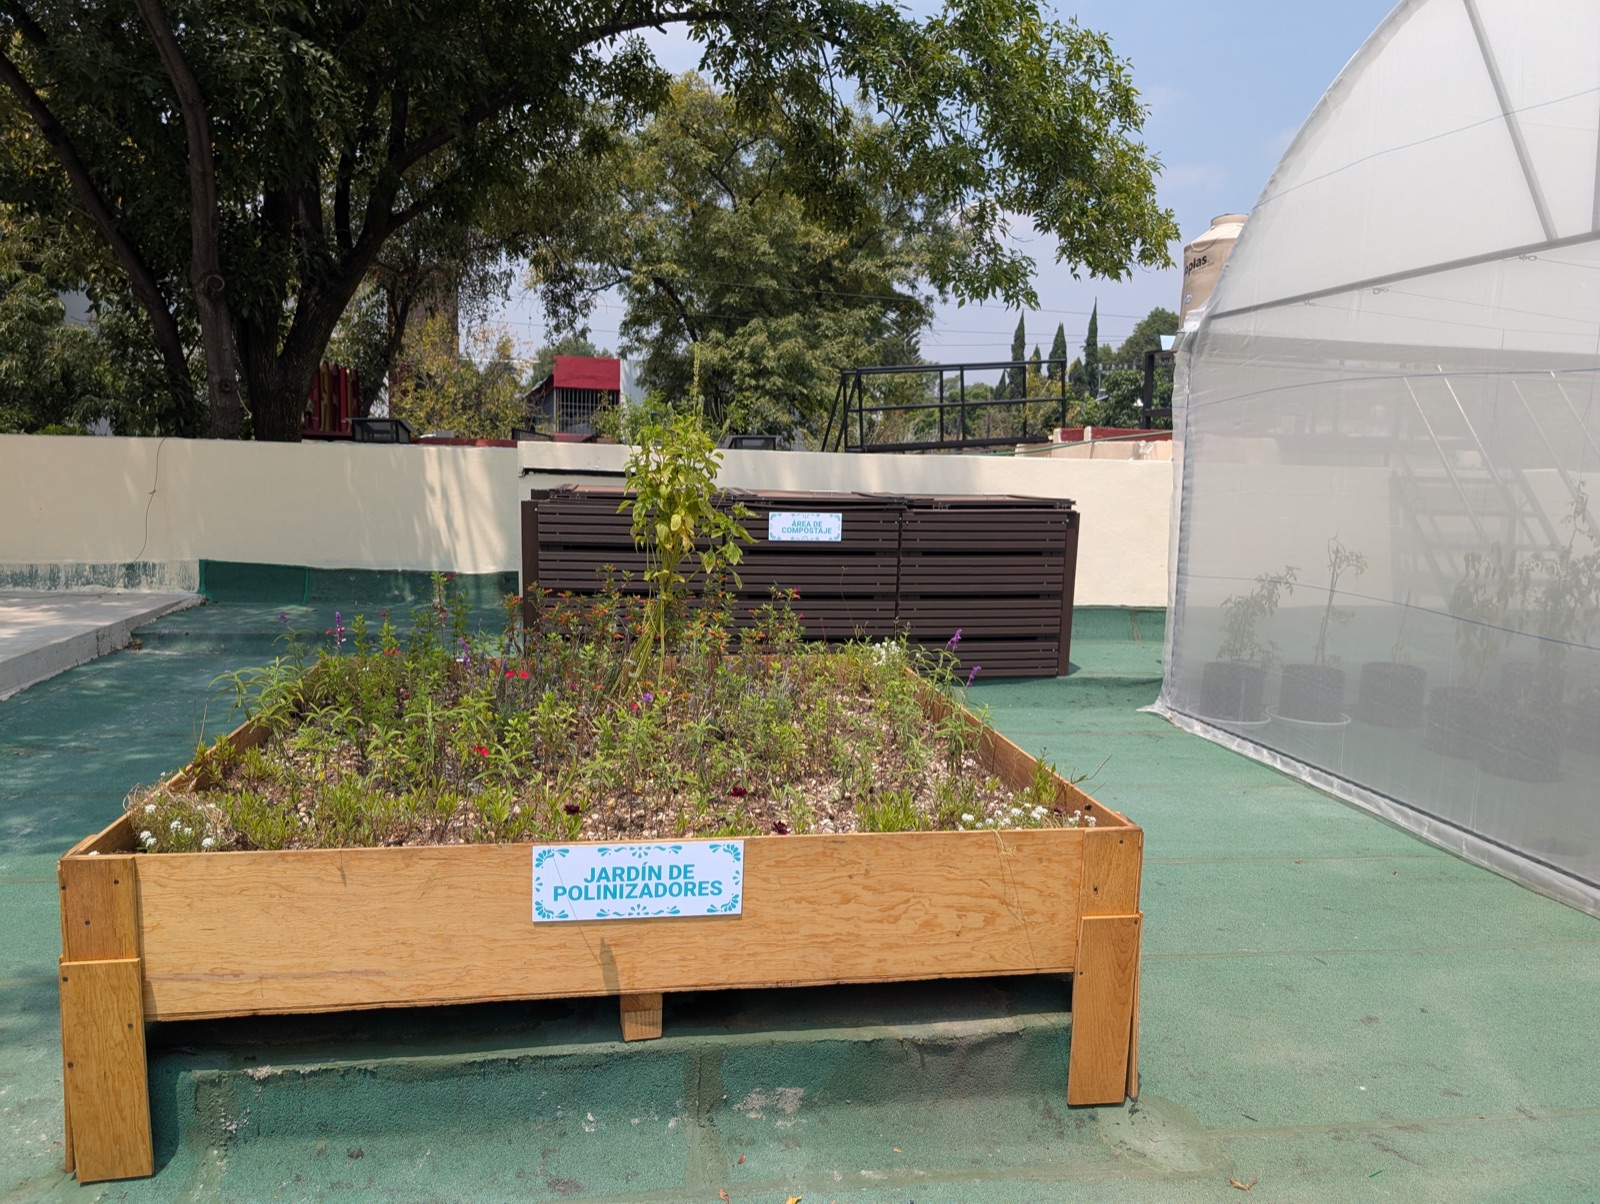
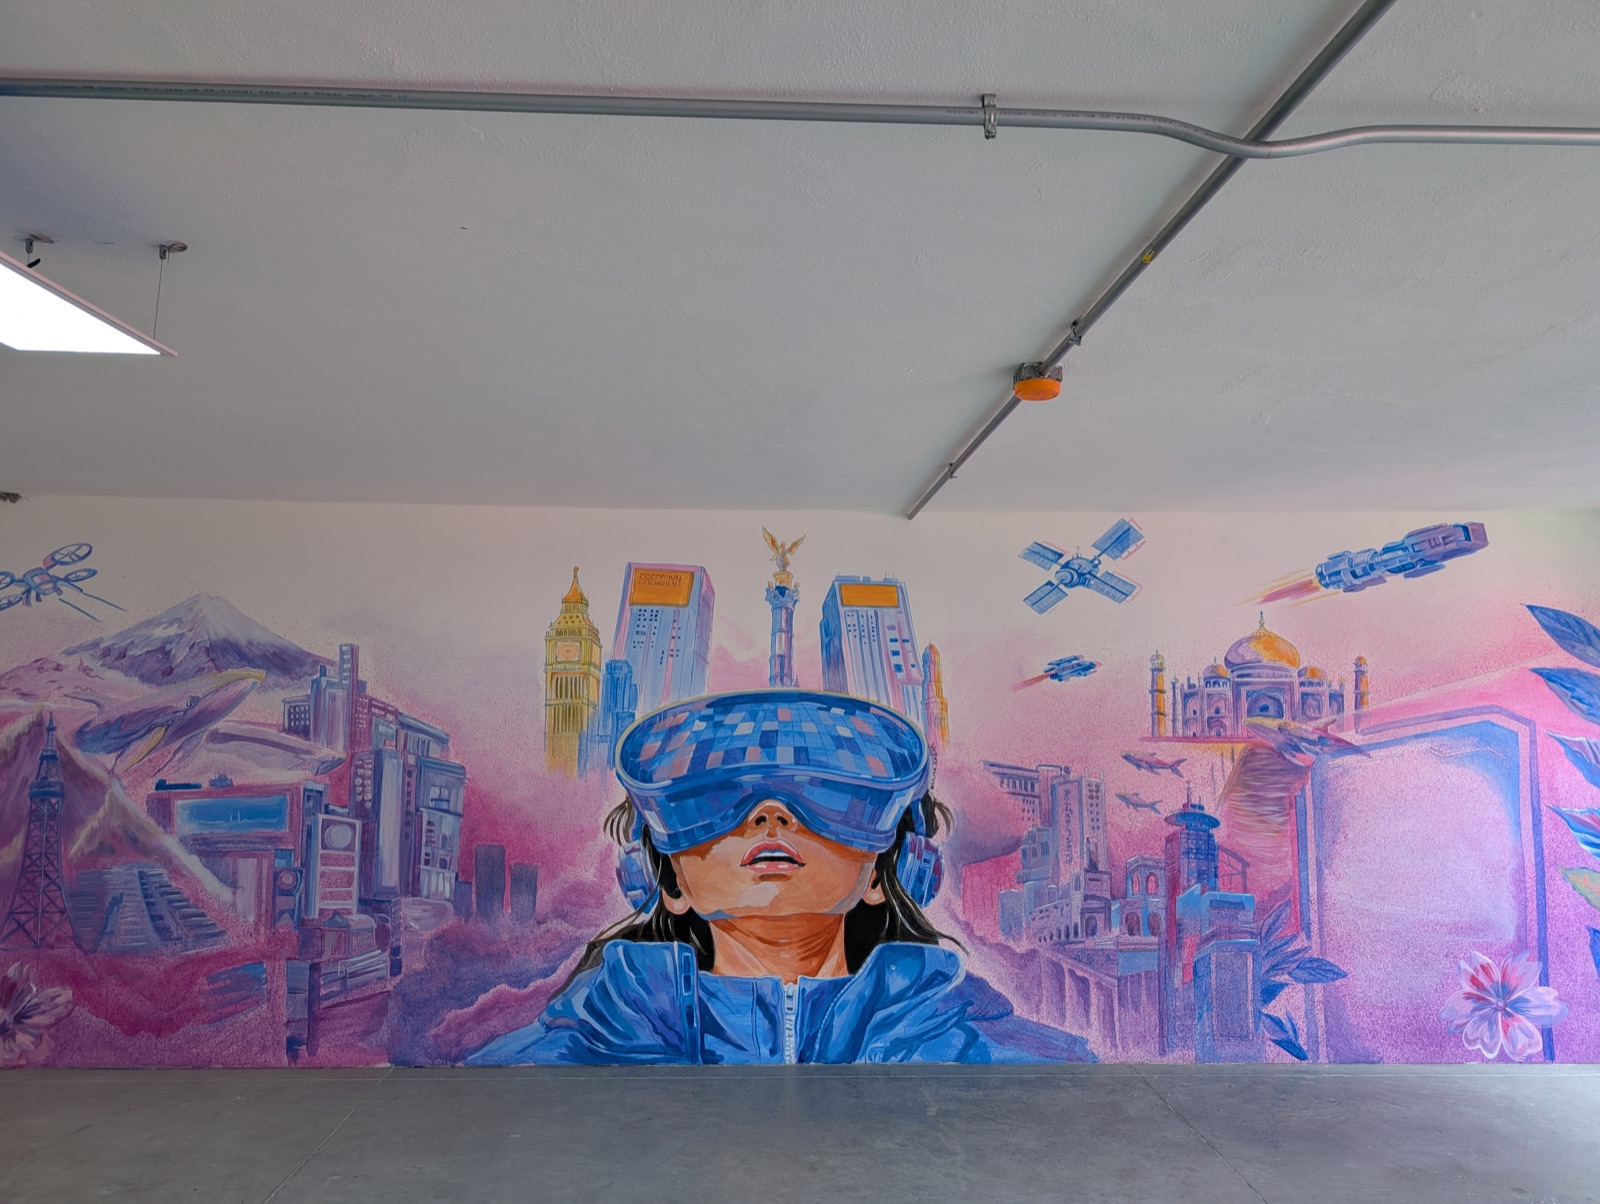
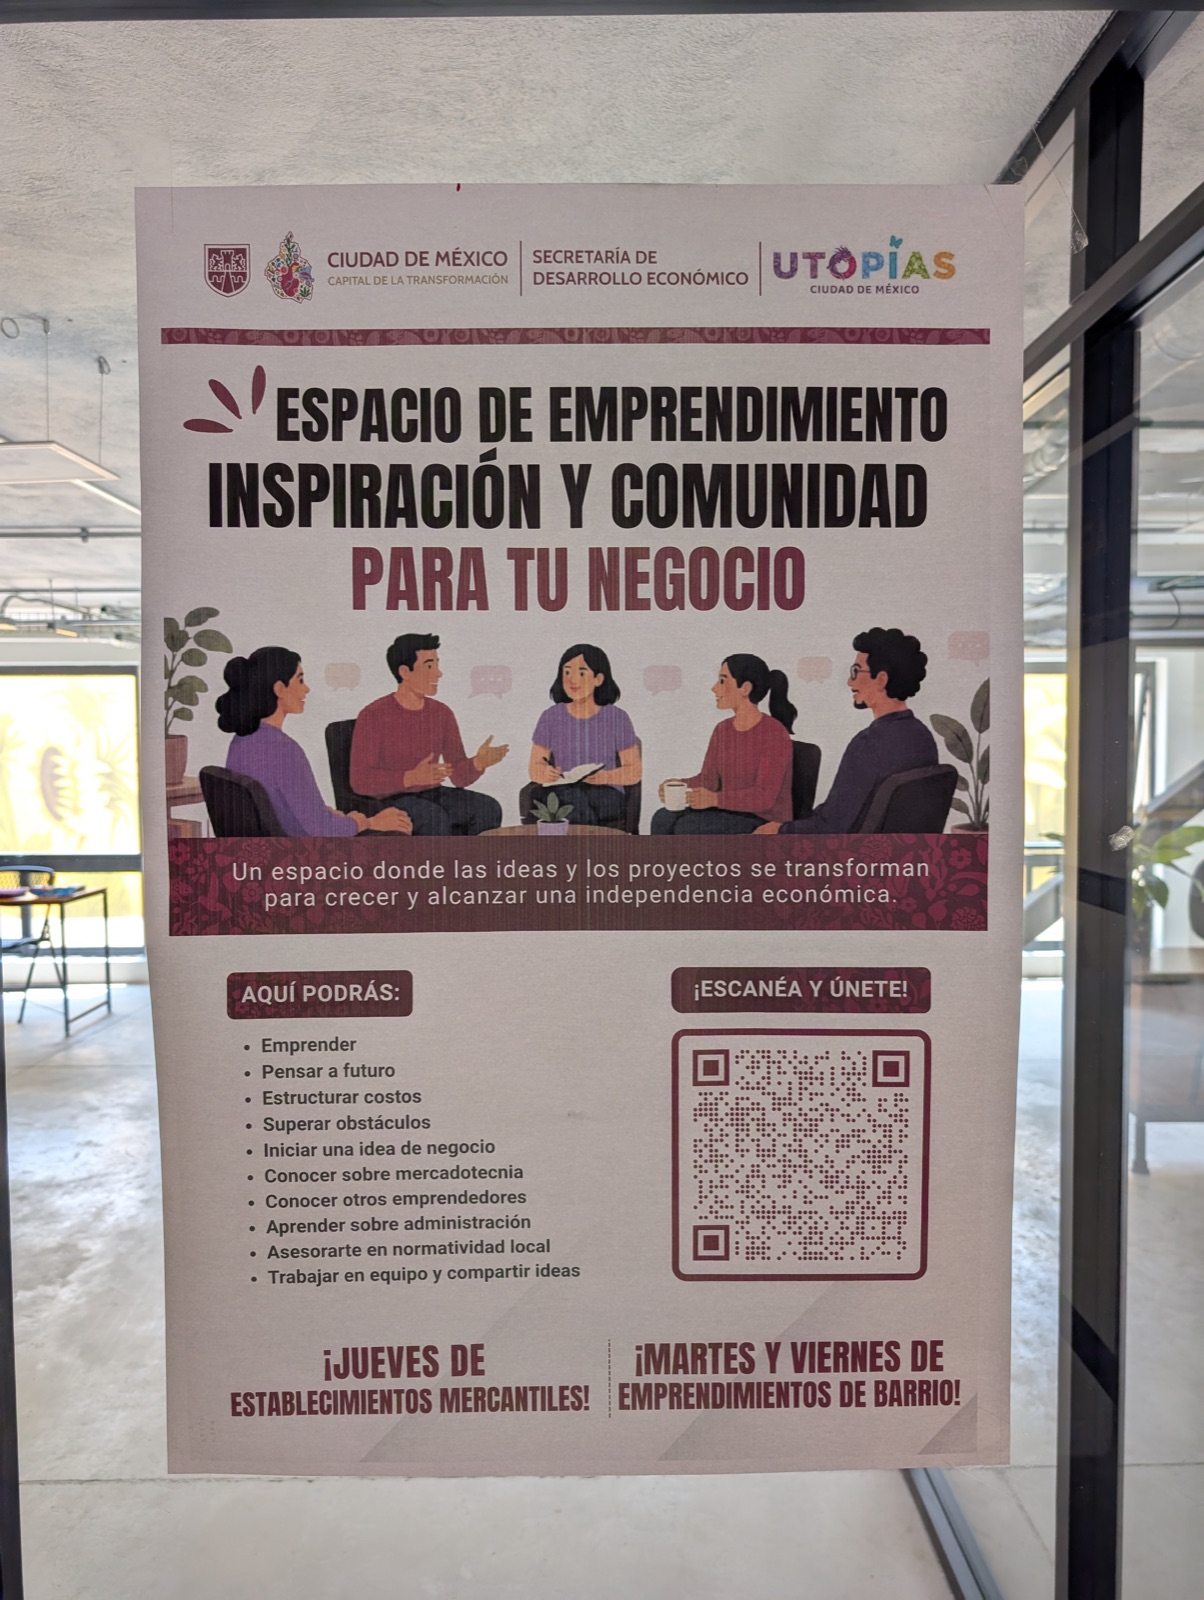
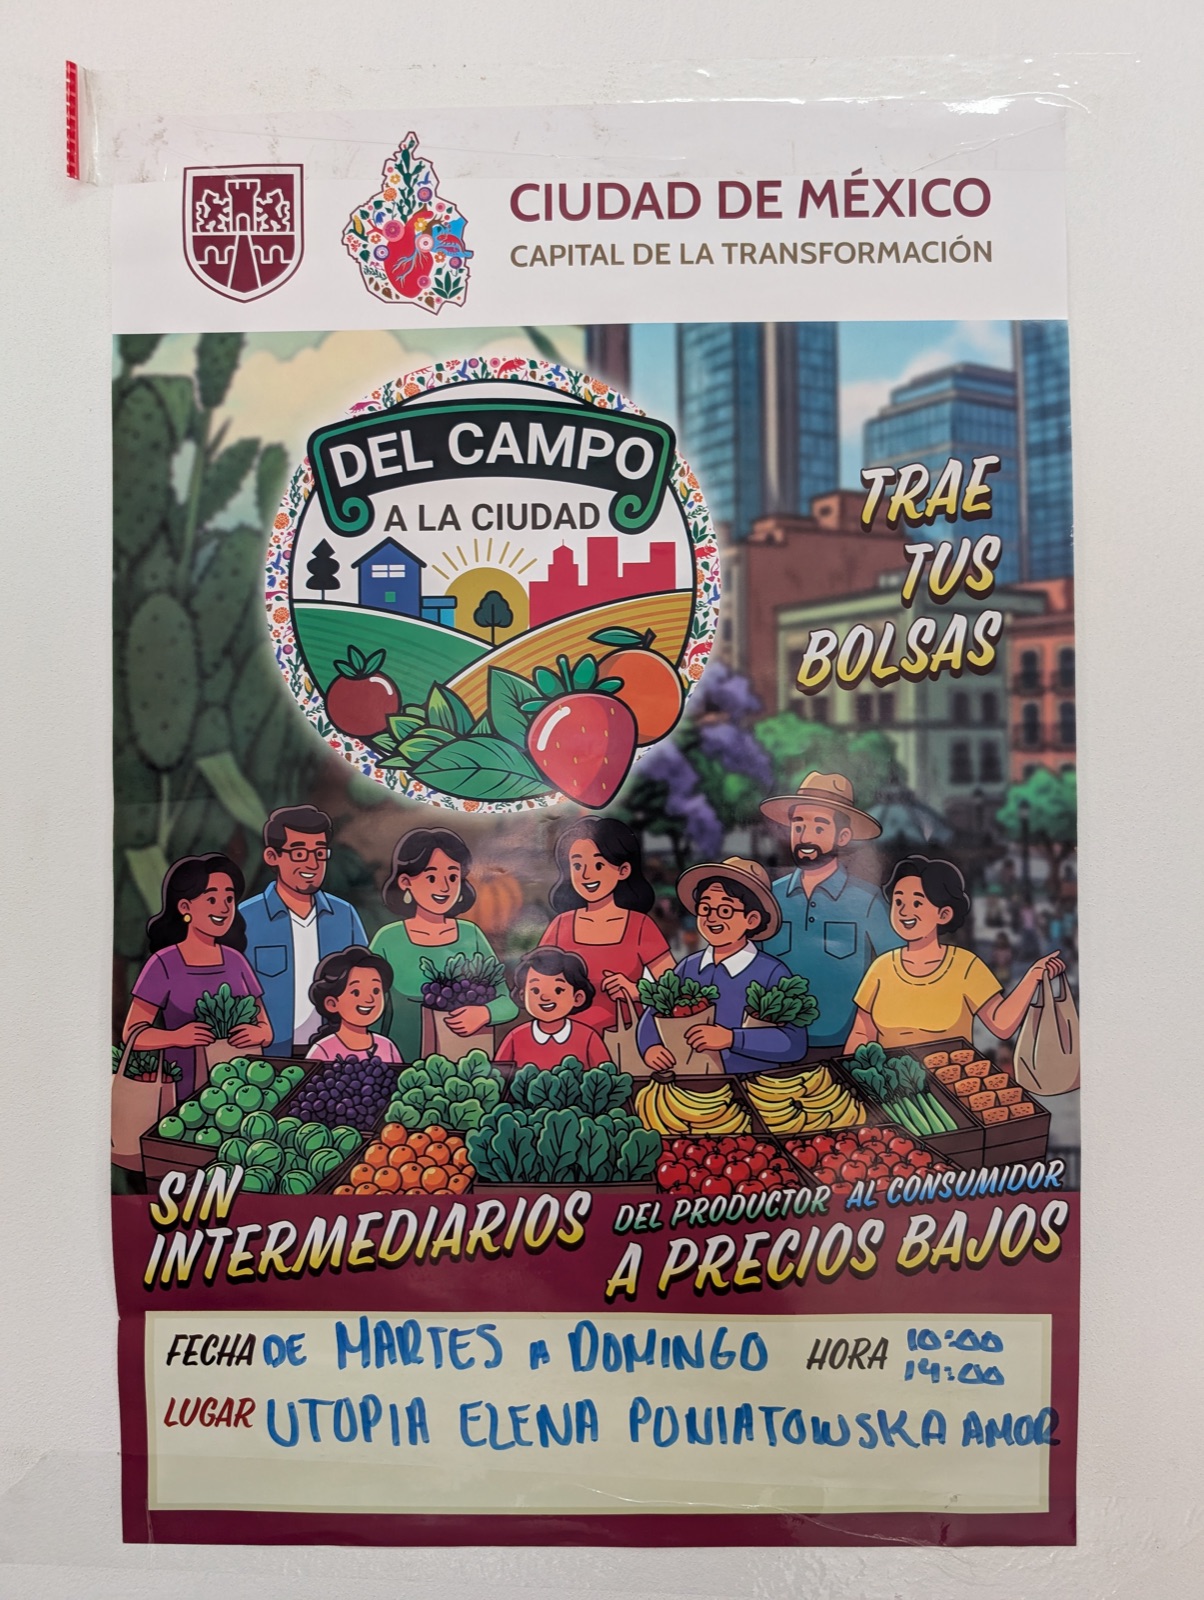
Some of the services at the UTOPÍA "Elena Poniatowska Amor" in Coyoacán: the entrance (axolotl included), the language and knowledge lab, the pollinator garden, the virtual reality space that was still under construction, the entrepreneurship space, and the farmers' market.
With all this investment in infrastructure to create third places, I started wondering how far these new projects actually reach. So, together with Natalia Cadavid-Aguilar, Roberto Ponce-López, and Alberto Meouchi-Vélez, from Tec de Monterrey, I did a study on the real access to the UTOPÍAS, looking at the 13 original ones in Iztapalapa. In short, we used human mobility data from cell phones to understand who visited the UTOPÍAS, when, and under what general circumstances.
We found very interesting usage patterns that have important implications for urban infrastructure planning. Specifically, they help us define who an amenity like this is built for and how far its reach will be, whether it will be local or attract people from all over the city. They also tell us whether we are going to encourage people to use the facilities regularly or simply create a tourist attraction that brings in visitors on weekends. Below I briefly go over the general results we got, which you can see in more detail in the full article (the link is at the end of the page).
How did we measure it?
The data we used comes from cell phone apps that record their users' location anonymously. With this data we detect when someone stayed for a while inside a UTOPÍA and, based on where they spend their nights and weekends, we estimate where they live. This way we can know which neighborhood or municipality each visitor comes from, how far they traveled, and how rich or poor the area where they live is. We looked at almost six months, from late September 2023 to the end of March 2024.
On top of that, we added three things that any government can know before building a UTOPÍA. The first is the public transit within one kilometer around it, using the city's open route data. The second is how unique each UTOPÍA's offer is, because having an outdoor gym, which almost all of them have, is not the same as having a planetarium or a dinosaur park. The third is the reported crime around each site, using the open data from the city's prosecutor's office.
Something important to keep in mind is that this kind of data tends to have more young and better-off users, so it's very likely that we are undercounting the poorest people, who are exactly the ones the UTOPÍAS want to reach. Also, with only 13 UTOPÍAS, everything we found is a relationship and not a cause.
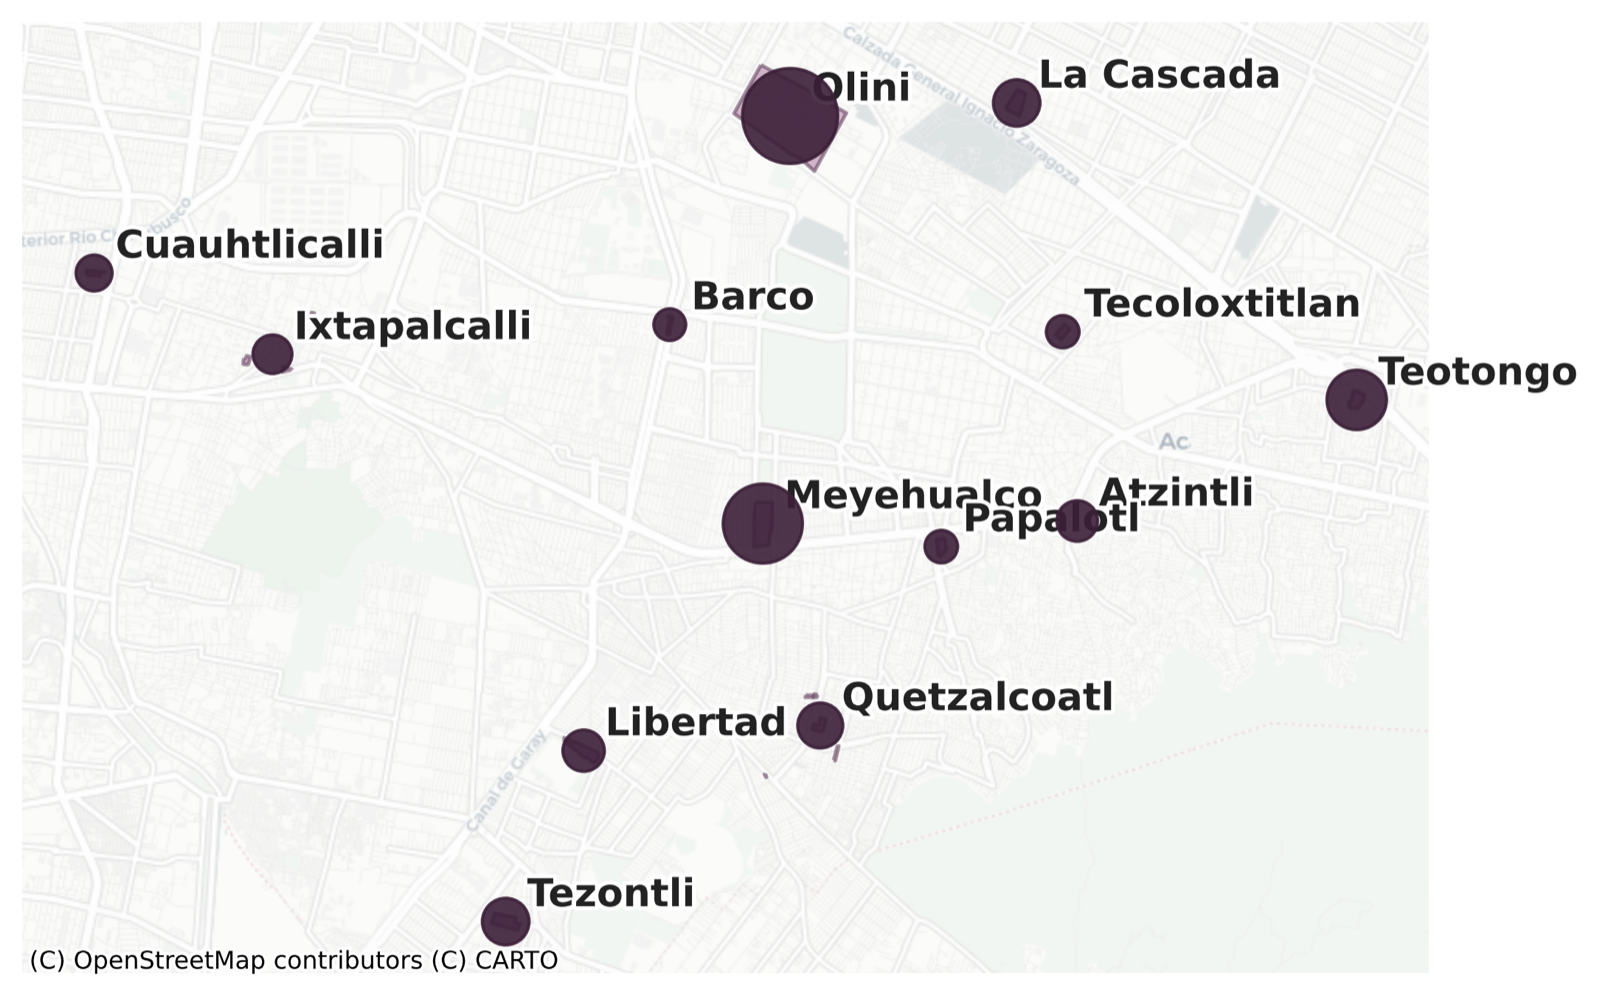
The 13 UTOPÍAS of Iztapalapa. The size of each circle goes with how many visitors it had.
Two giant UTOPÍAS and many neighborhood ones
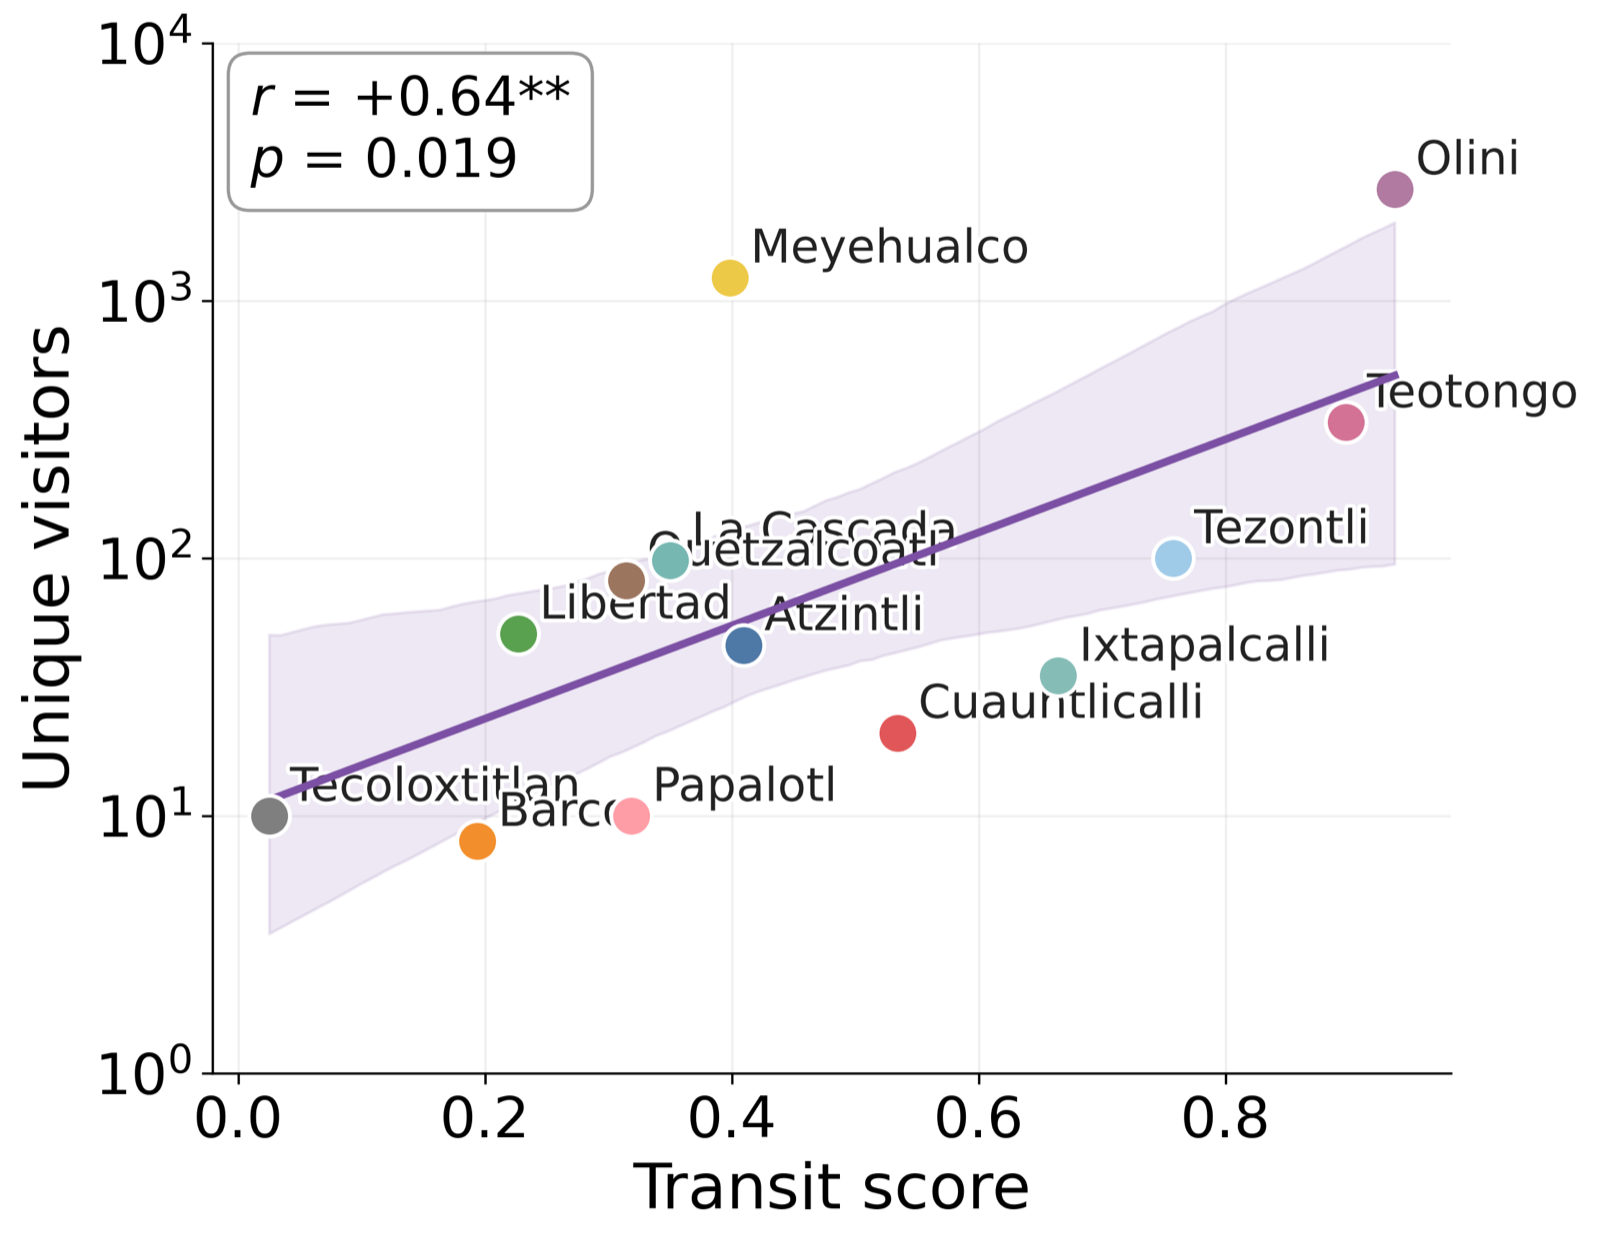
The first thing we saw is that not all UTOPÍAS get the same number of people, not even close. Olini and Meyehualco take more than four out of every five visitors we detected, with around 2,700 and 1,200 unique visitors, respectively. Next comes Teotongo with a little over 300, and the rest get anywhere from a few dozen to about a hundred. Careful, this doesn't mean the smaller UTOPÍAS are empty. What happens is that they are visited by a smaller group of people who live nearby and go very consistently.
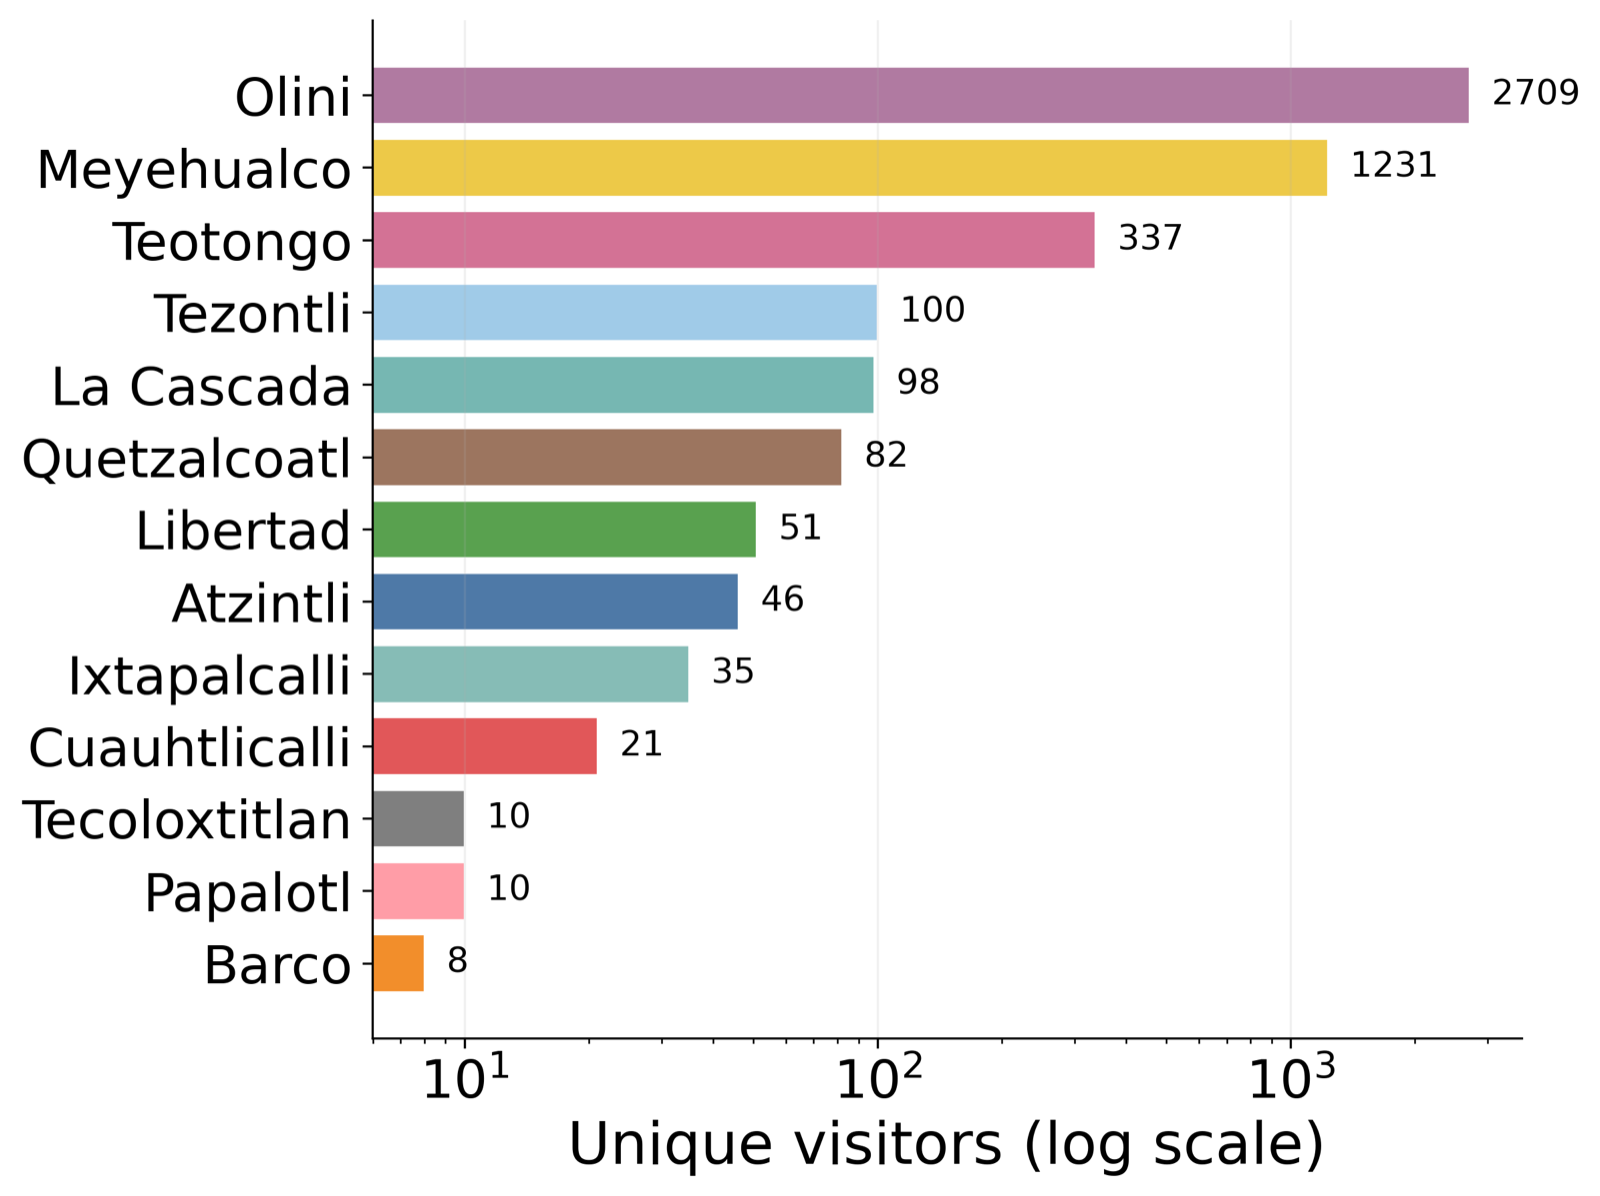
Unique visitors per UTOPÍA. Watch the scale, each mark is ten times the one before.
Something I found really interesting is where people come from. Overall, a little more than half of the visitors (around 55%) come from outside Iztapalapa, and roughly one in five comes from municipalities in the State of Mexico like Nezahualcóyotl. After Iztapalapa, the boroughs that send the most visitors are Coyoacán, Cuauhtémoc, and Iztacalco. But this happens almost only at the two biggest ones, because at Olini and Meyehualco less than half of their visitors live in Iztapalapa. In contrast, UTOPÍAS like Papalotl, Atzintli, or Tecoloxtitlan get more than 90% of their people from Iztapalapa.
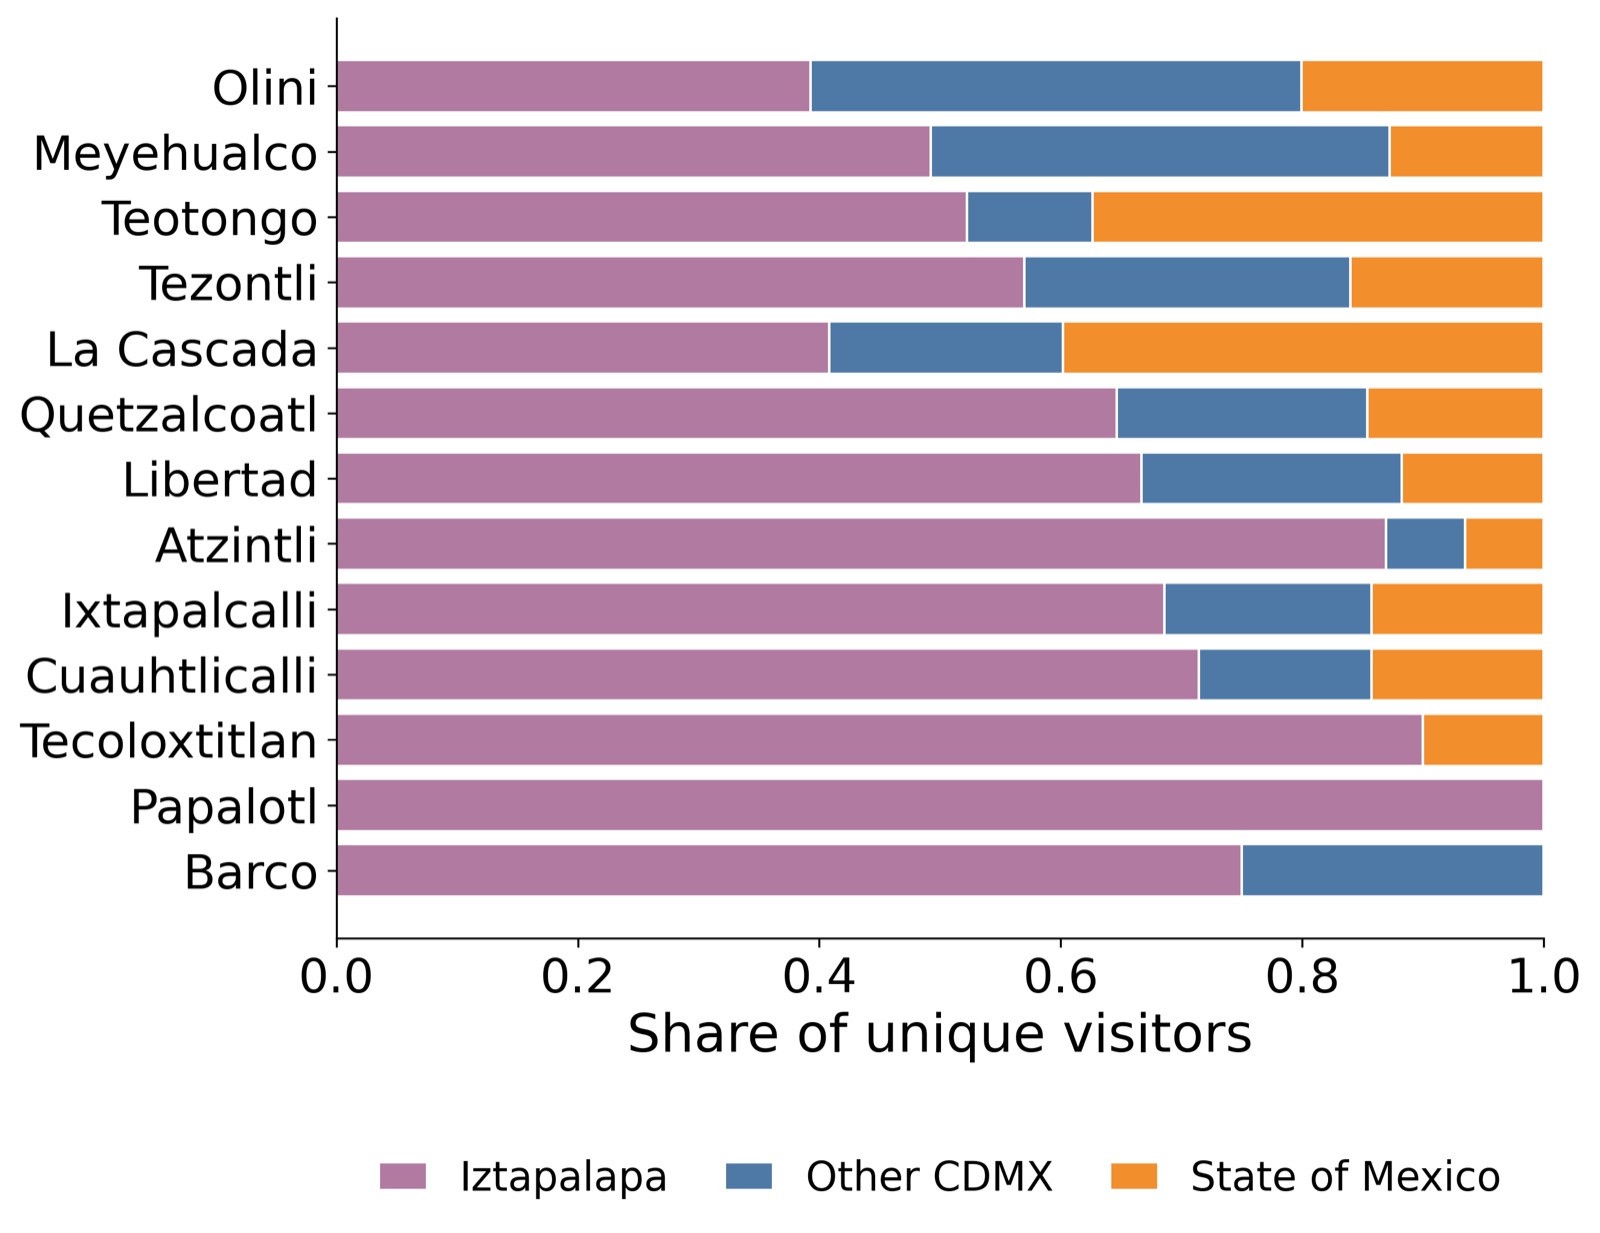
Where each UTOPÍA's visitors come from. Purple is Iztapalapa, blue is the rest of Mexico City, and orange is the State of Mexico.
Over time, visits grew little by little. In October 2023 we saw around 20 visitors a day across the whole network, and by early February there were about 60, before dropping a bit in March. Something we didn't expect is that the difference between weekends and weekdays is super small, which tells us that the UTOPÍAS are used all week long and are not just a Sunday outing. During the day, visits go up in the afternoon and reach their highest point in the evening.
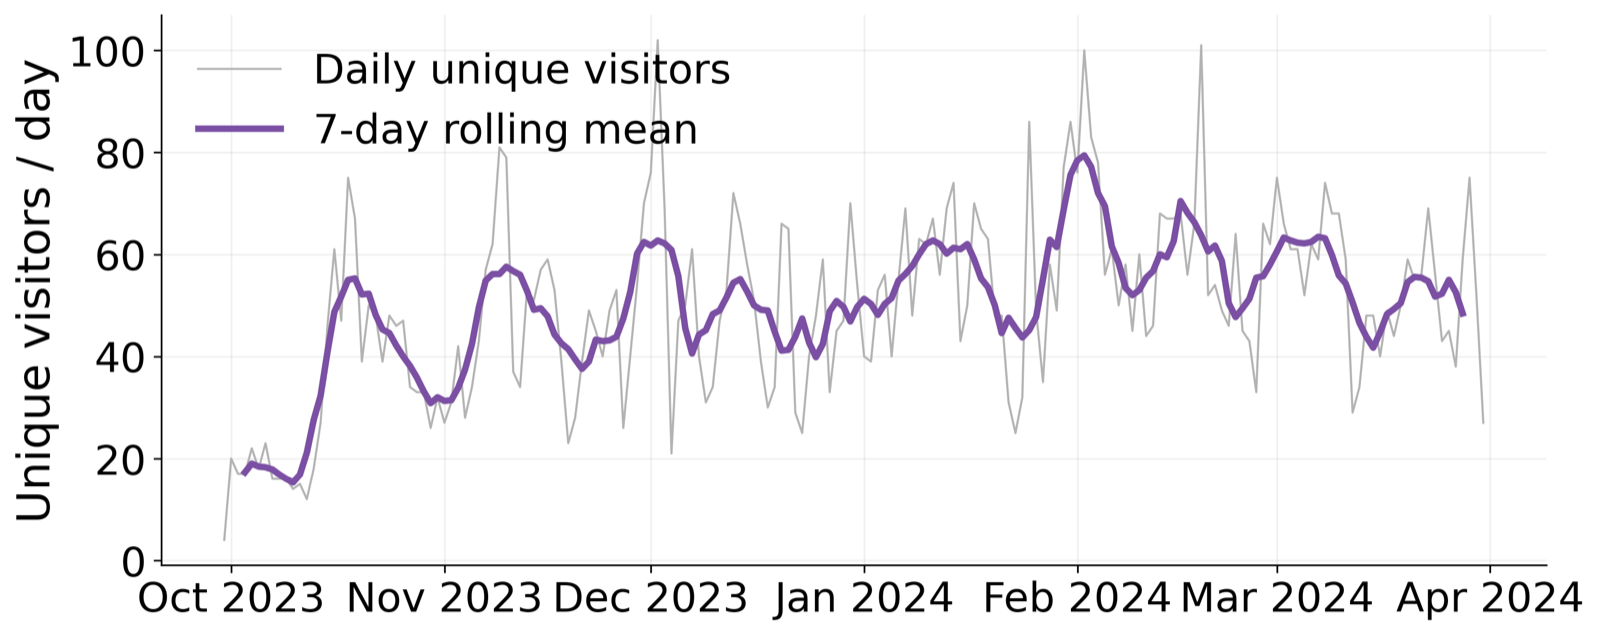
Unique visitors per day across the whole network. The purple line is the average of the last seven days.
Public transit goes with how many people arrive
Of the three things we measured, public transit is the one most related to how many people visit a UTOPÍA. The UTOPÍAS with more routes and more weekday trips within one kilometer are the ones that get more visitors (r = 0.64). And here comes something curious. If instead of transit we use the classic measure of accessibility, which basically counts how many people live nearby, we don't find any relationship with visits. In other words, being surrounded by lots of people isn't enough, what matters is how easy it is to get there.
Olini is the best example of this. Around it there are 115 routes from five types of transit, including the Metro, Metrobús, RTP buses, bus corridors, and a ton of microbuses.
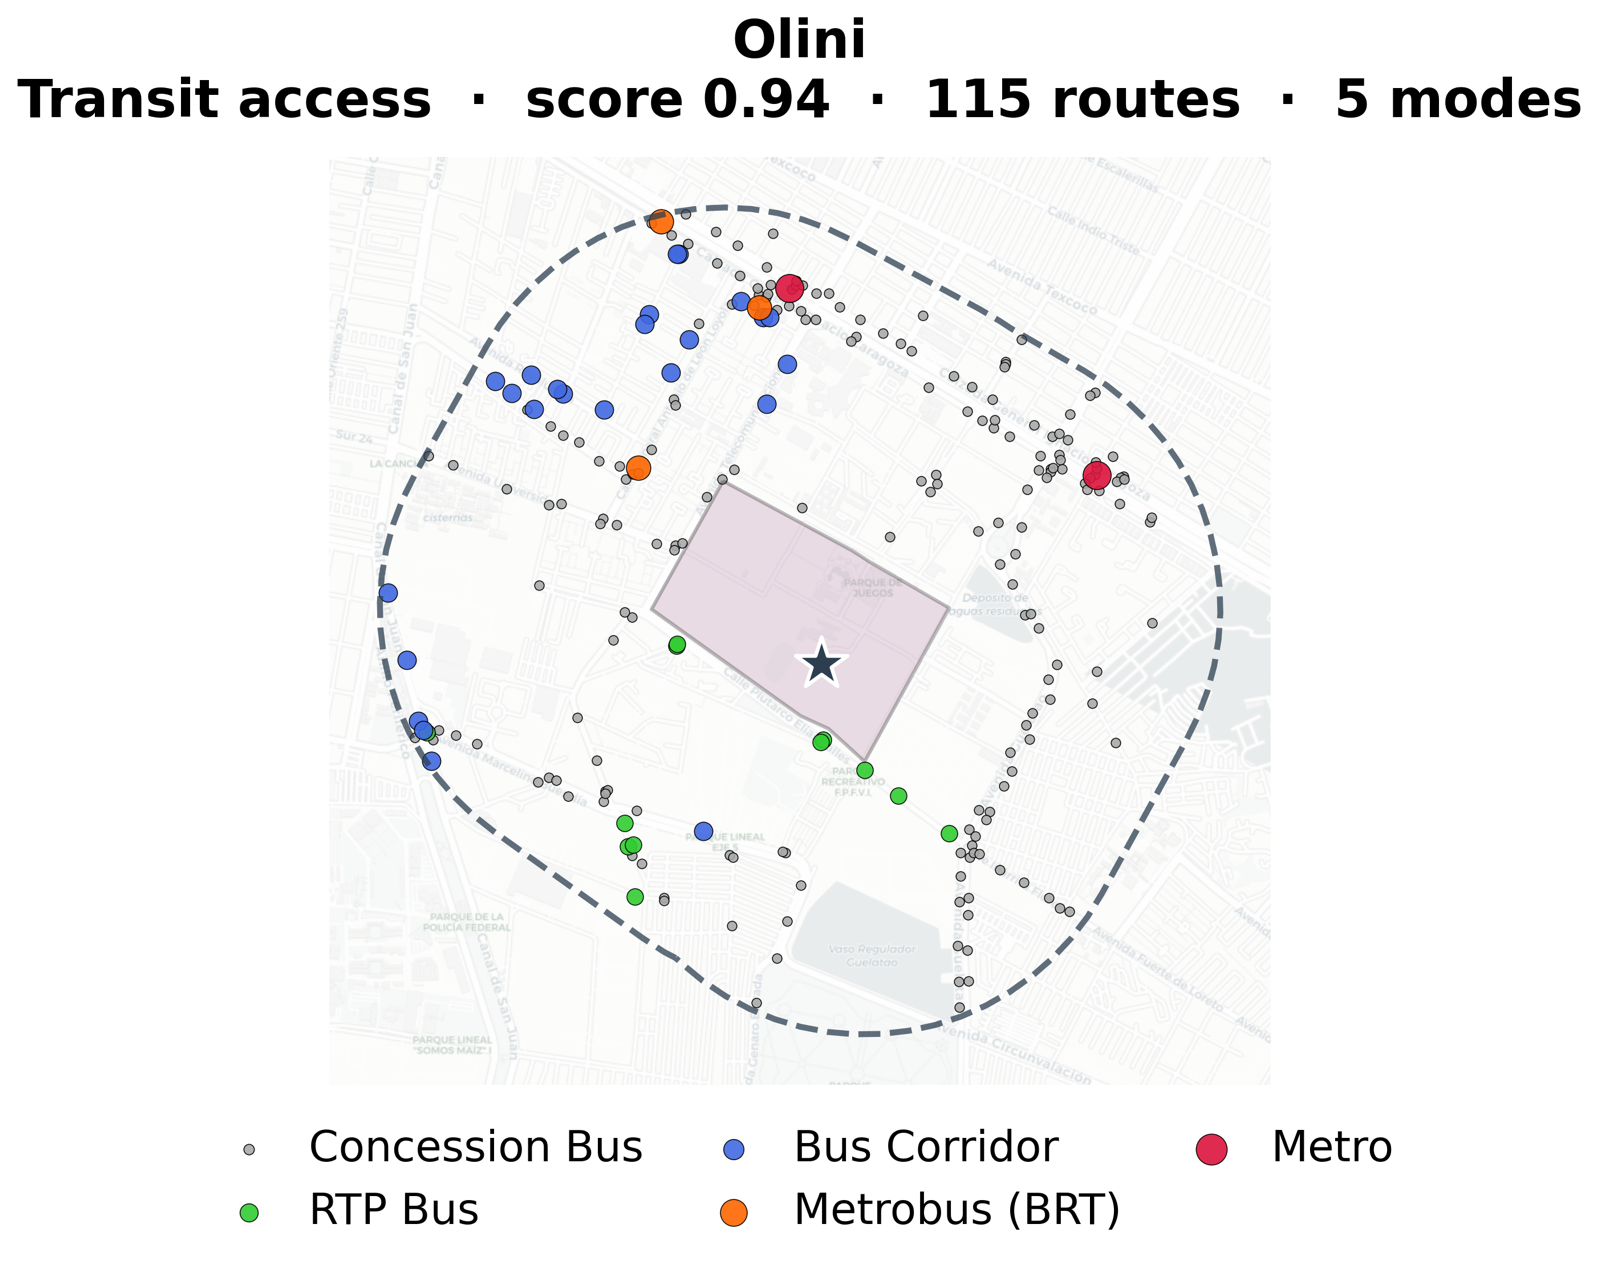
All the public transit stops within one kilometer of Olini.
What a UTOPÍA offers goes with how far people come
You would think that the UTOPÍAS with more stuff, or with more spectacular stuff, would be the most visited, but that's not the case. How unique a UTOPÍA's offer is has nothing to do with how many visitors it gets (r = 0.05). What does change is how far people come from, especially on weekends. We call this the "weekend distance premium", which is how many more kilometers weekend visitors travel compared to weekday visitors. The UTOPÍAS with things that don't exist anywhere else in the network, like a planetarium, a wave pool, or a dinosaur park, have a much bigger premium (r = 0.68). The clearest case is Barco, which is the UTOPÍA with the most unique offer and where weekend visitors travel more than 8 km extra.
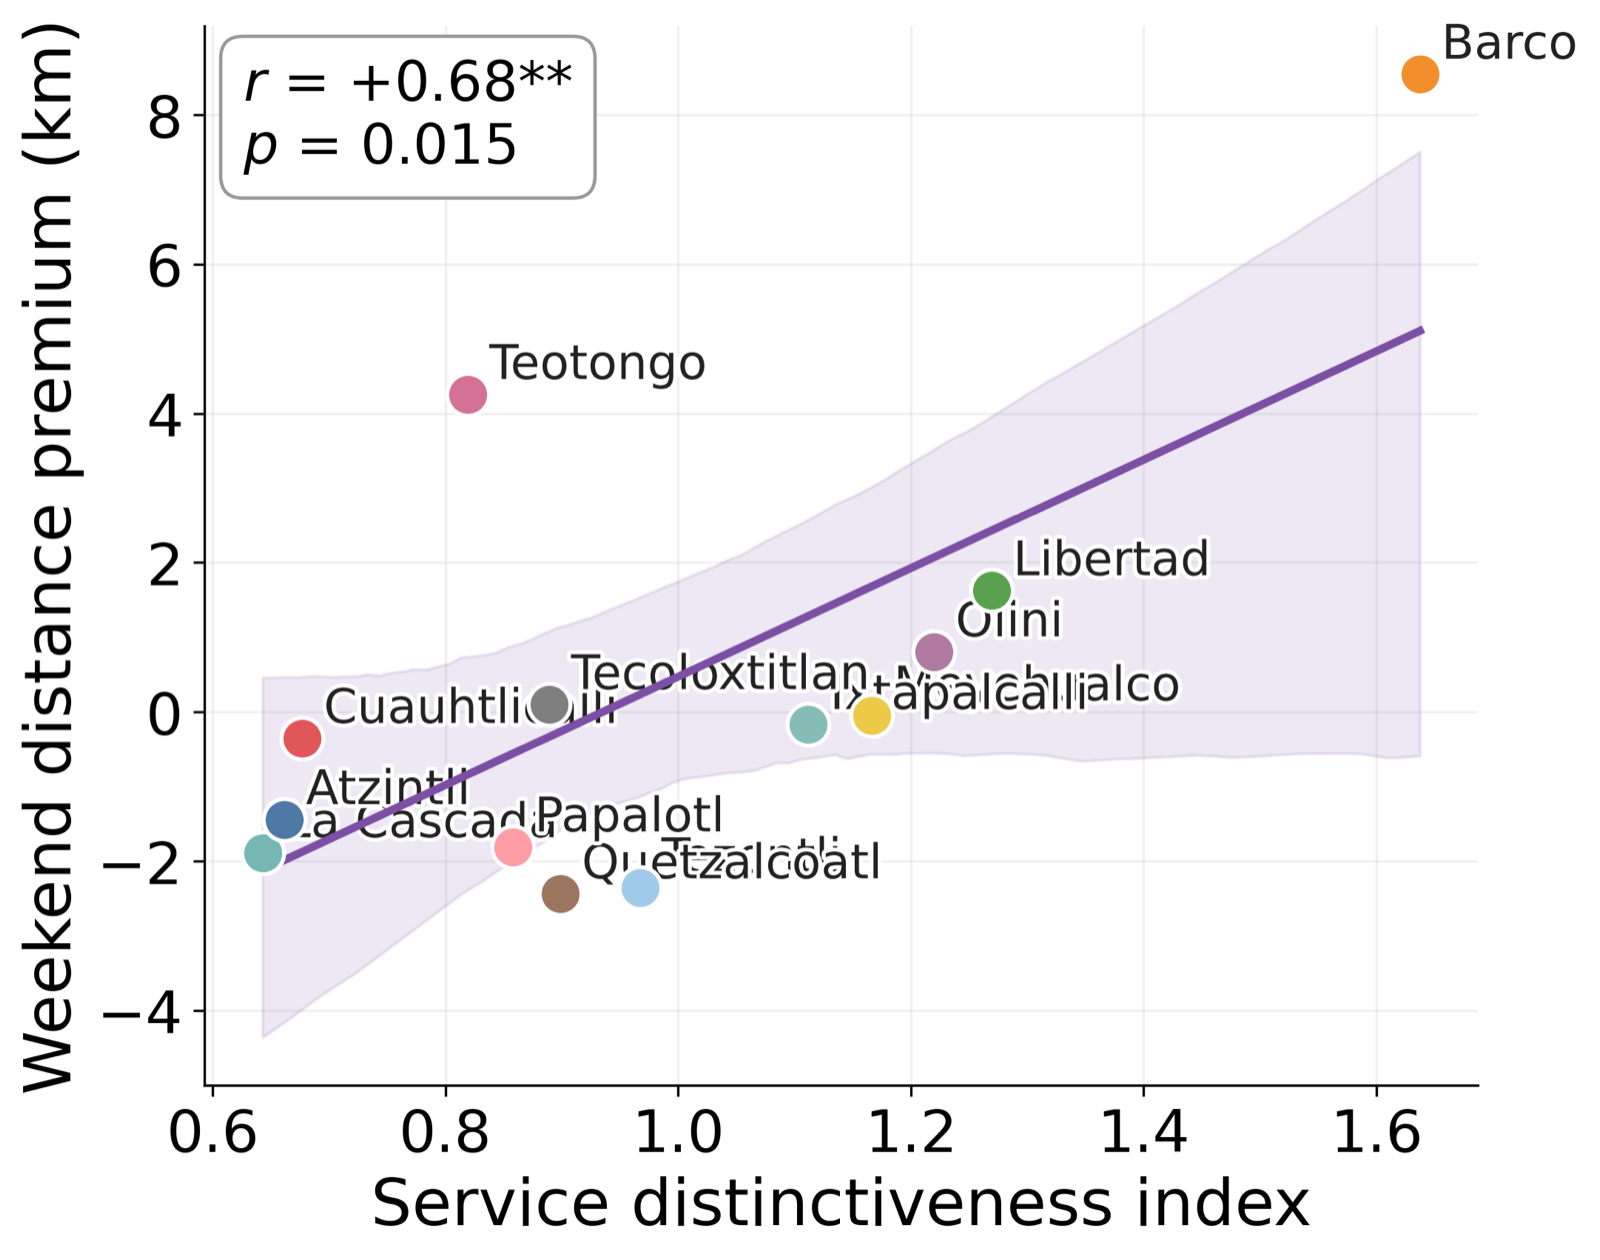
On the other hand, the more everyday things, like gyms and courts for team sports, do go hand in hand with more visitors. This makes sense, because these are things people use often and close to home. In short, unique attractions make people come from farther away, but they don't make more people come.
Violence around a UTOPÍA goes with who arrives
Another thing we didn't expect is that the total amount of crime around a UTOPÍA has no relationship with how many people visit it. What we did find is that the share of violent crimes (homicides, rapes, kidnappings, and violent robberies) is strongly related to who arrives. UTOPÍAS in areas with a higher share of violent crime get visitors who live in poorer areas (r = −0.75) and who come from closer by.
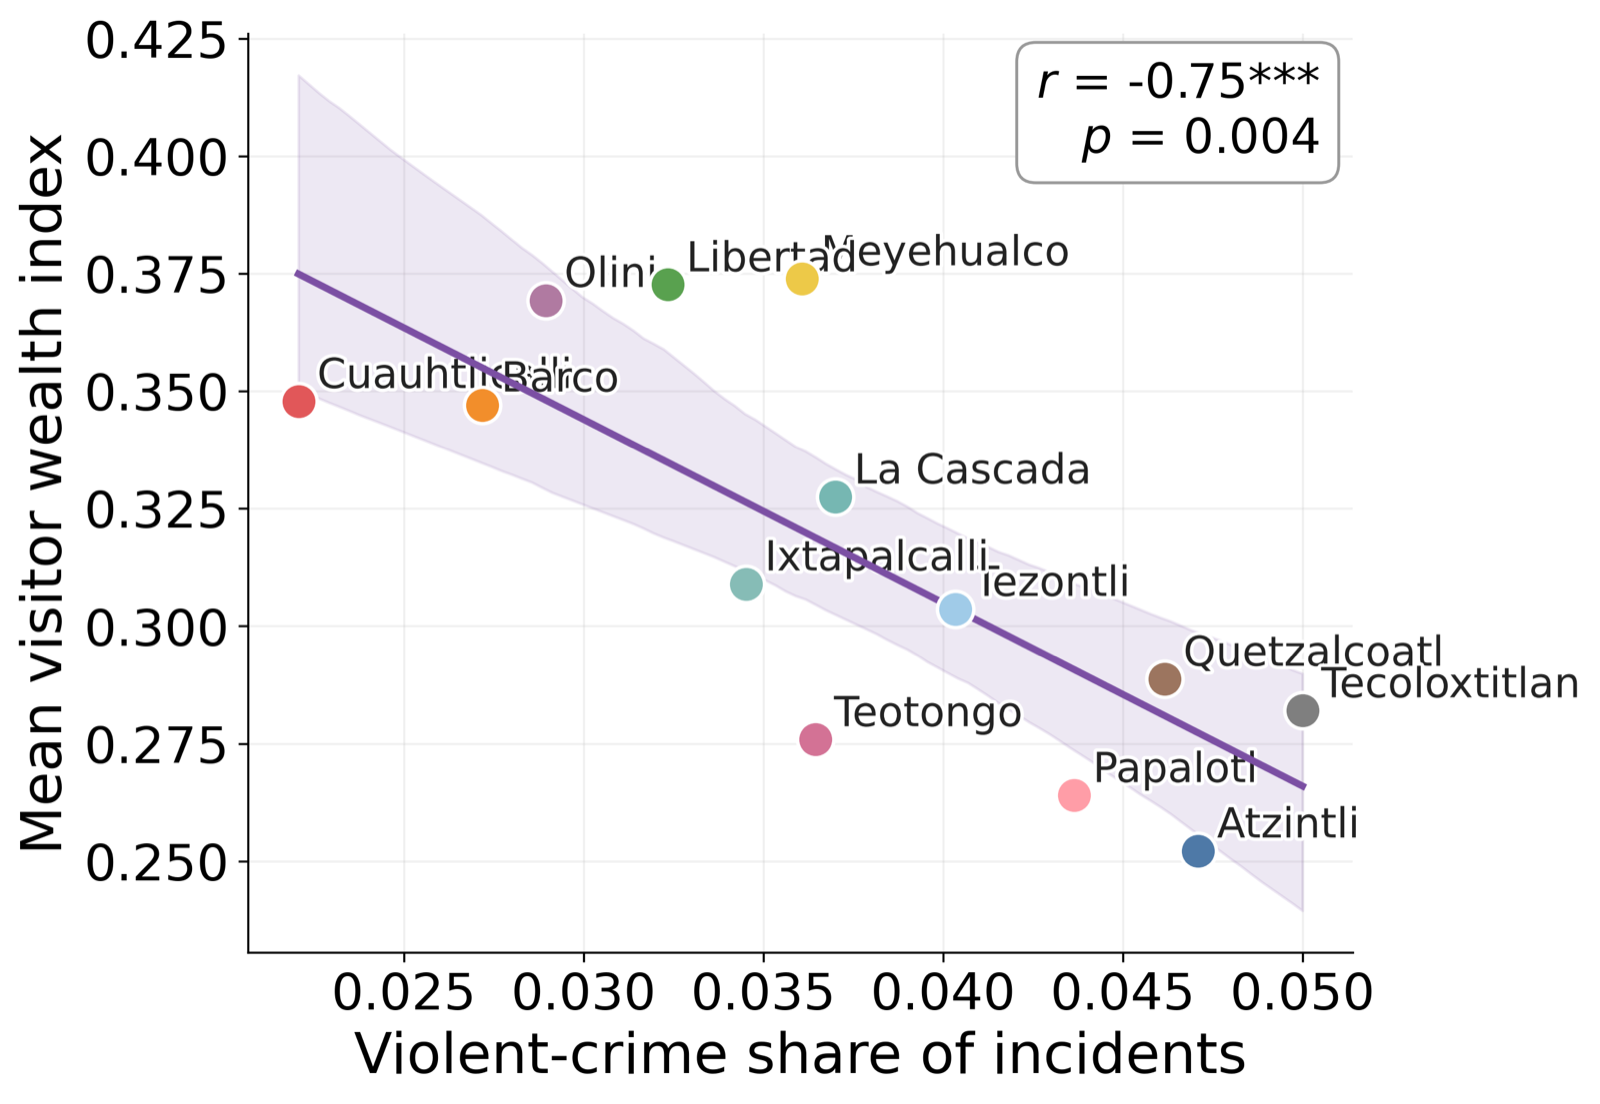
Here we have to be very careful, because this doesn't mean that violence decides where people go. In Iztapalapa, the most violent areas and the poorest areas tend to be the same ones, so one possible explanation is that people from those neighborhoods go to the UTOPÍA closest to them, while those with more resources (who mostly don't live there) prefer to go to the safer and better-connected UTOPÍAS. With our data we know where people live and which UTOPÍA they reach, but not why they chose it, so we leave this as a hypothesis.
Four types of UTOPÍA
Putting together transit and how unique the offer is, which are the two things a government can decide directly, we can split the UTOPÍAS into four types. Flagship destinations have good transit and things you can't find anywhere else, like Olini, Meyehualco, Tezontli, and Ixtapalcalli. Connected neighborhood hubs have good transit but a more standard offer, like Teotongo, Atzintli, and Cuauhtlicalli. Under-connected attractions have unique things but little transit, like Libertad, Barco, and Quetzalcoatl. And neighborhood spaces have neither much transit nor special things, and mostly serve the people who live around them, like La Cascada, Papalotl, and Tecoloxtitlan.
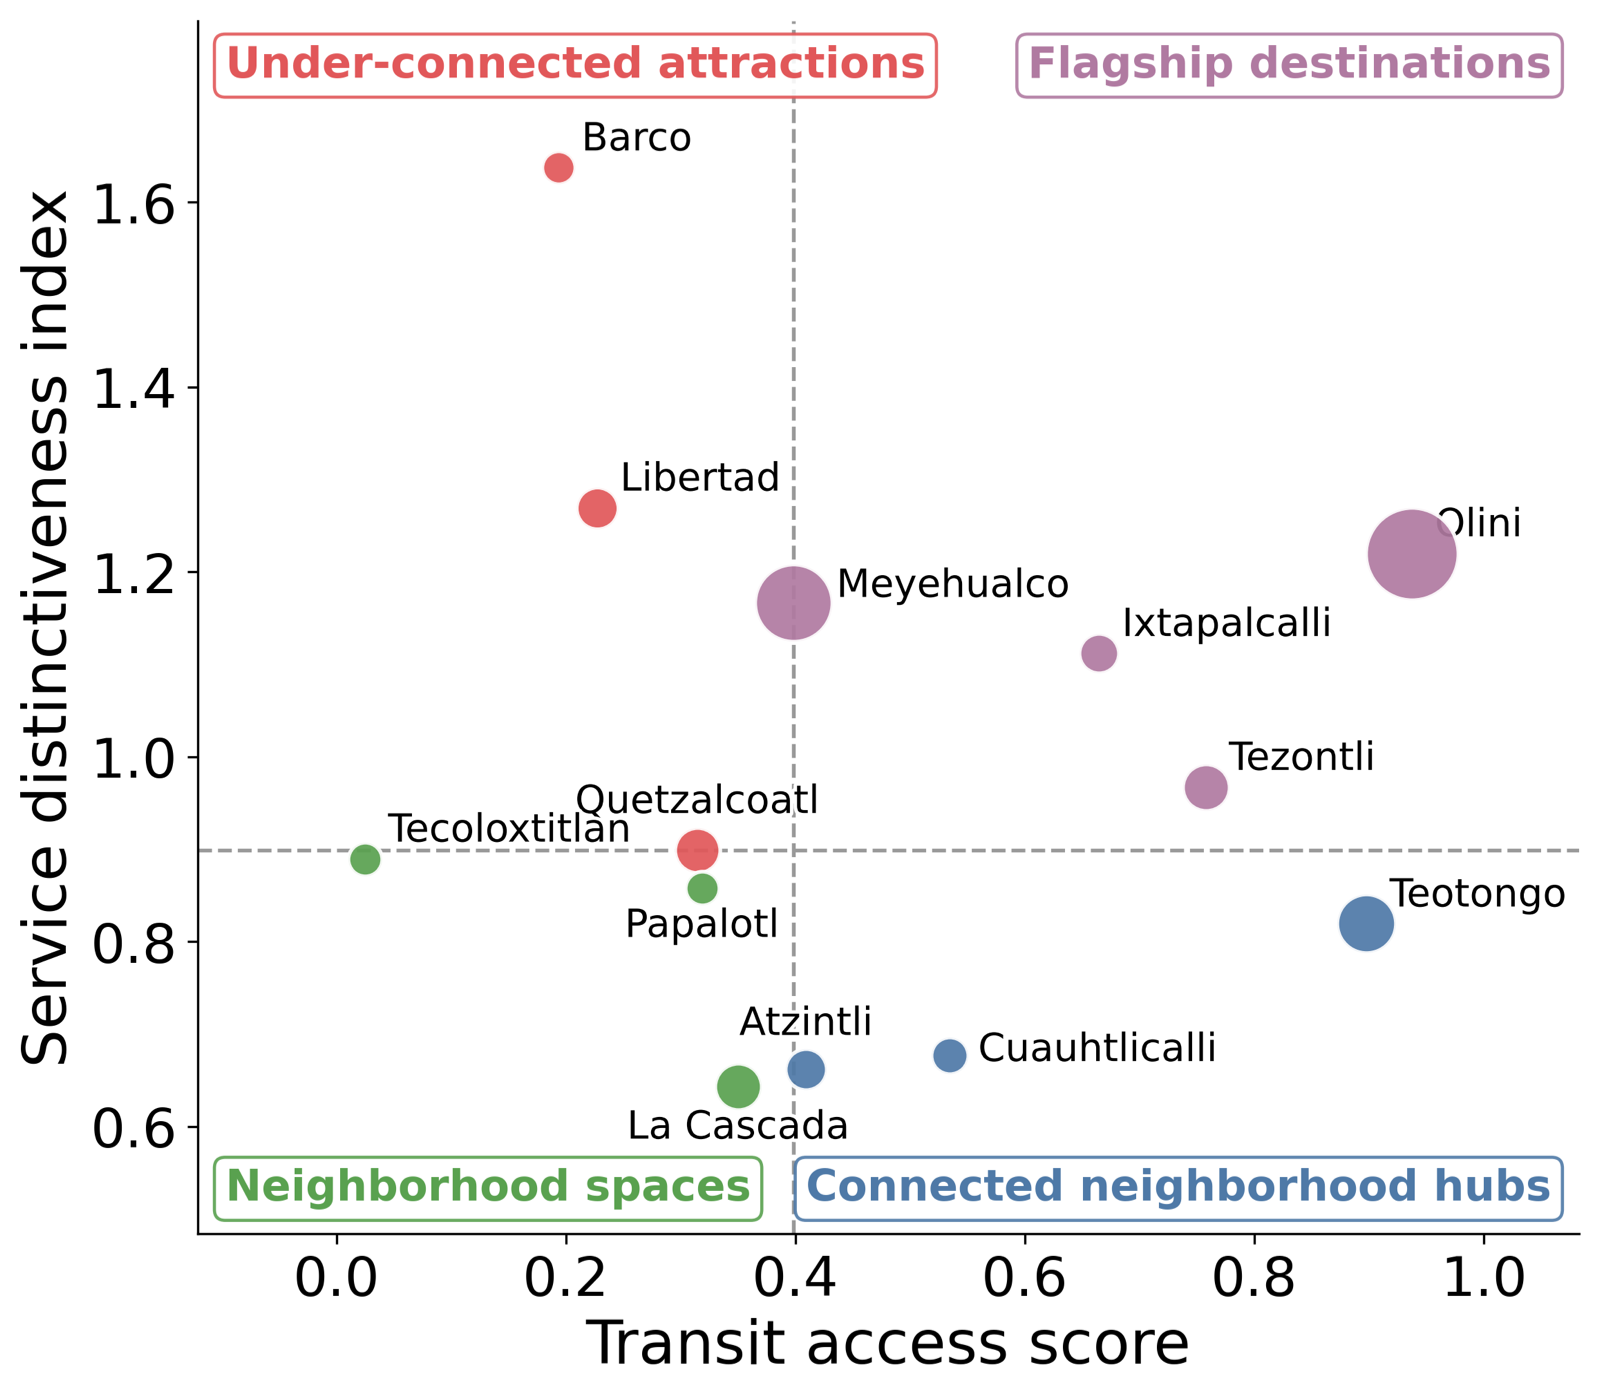
Each UTOPÍA by its transit (horizontal axis) and how unique its offer is (vertical axis). The size of the circle goes with its visitors.
So what is this useful for?
For me, the most useful part of all this is that, before starting to build, a government can check how much public transit there is around a site. The route data is public and the analysis is pretty simple, and it's exactly what is most related to how many people will show up. I also think we need to be careful with how we evaluate each UTOPÍA. A UTOPÍA in an area where almost everyone has few resources is going to get almost only visitors with few resources, no matter how well it's built, and that doesn't make it a worse UTOPÍA. It's actually doing its job in its neighborhood.
Finally, the unique attractions really depend on what we want to achieve. A planetarium or a dinosaur park won't fill a UTOPÍA on weekdays, but they do make people from all over the city come on weekends. If the goal is for people from different places and income levels to meet in the same place, these attractions do bring something real. But if the goal is for the people around it to use it every day, it's probably better to invest in transit or in everyday things like gyms and courts. In the end, both options create third places, just for different audiences, and now that the UTOPÍAS are expanding across the whole city, it's really worth thinking from the start about who we are building each one for.
Paper: Langle-Chimal, O. D., Cadavid-Aguilar, N., Meouchi-Vélez, A., and Ponce-López, R. (2026). "Evaluating the reach and equity of public spaces in Mexico City using mobility data: the case of the Utopías in Iztapalapa." Frontiers in Big Data, 9:1942458.