Do you remember March 2020?
You probably do. From one day to the next, the message everywhere was "stay home". Back then I even wrote a post about social distancing and self-isolation, with toy models to understand why staying home helped slow down the virus. But there was something that bothered me a lot even then, which is that not all of us could stay home. Lots of people live day to day, work in the informal sector or in jobs that can't be done from a computer, and if they don't go out to work they simply don't eat.
We were able to measure that intuition years later. We used anonymous location data from 281 million phones in six middle-income countries (Brazil, Colombia, Indonesia, Mexico, the Philippines, and South Africa) during all of 2020. With this data we can know where each user lives, where they work, and how their mobility changed with the pandemic. Then we combined it with a wealth index built from each country's census data, to compare people living in the richest neighborhoods of each city (where 20% of the population lives) with people living in the neighborhoods with the fewest resources (where 40% of the population lives). Below I tell you what we found and, as always, you can find the full paper at the end of this text.
Staying home was a privilege
The first thing we looked at was who stayed home all day. Compared to before the pandemic, the share of people who didn't leave their home all day grew by 252% in the rich neighborhoods, but only 141% in the neighborhoods with fewer resources. That's a difference of 111 percentage points, and it shows up in all six countries, from 36 points in the Philippines to 175 in South Africa. A good part of this difference comes from work, because the time people spent at their workplace dropped 40% in the rich neighborhoods and only 29% in the ones with fewer resources. In other words, being able to work from home seems to be one of the things that mattered most.
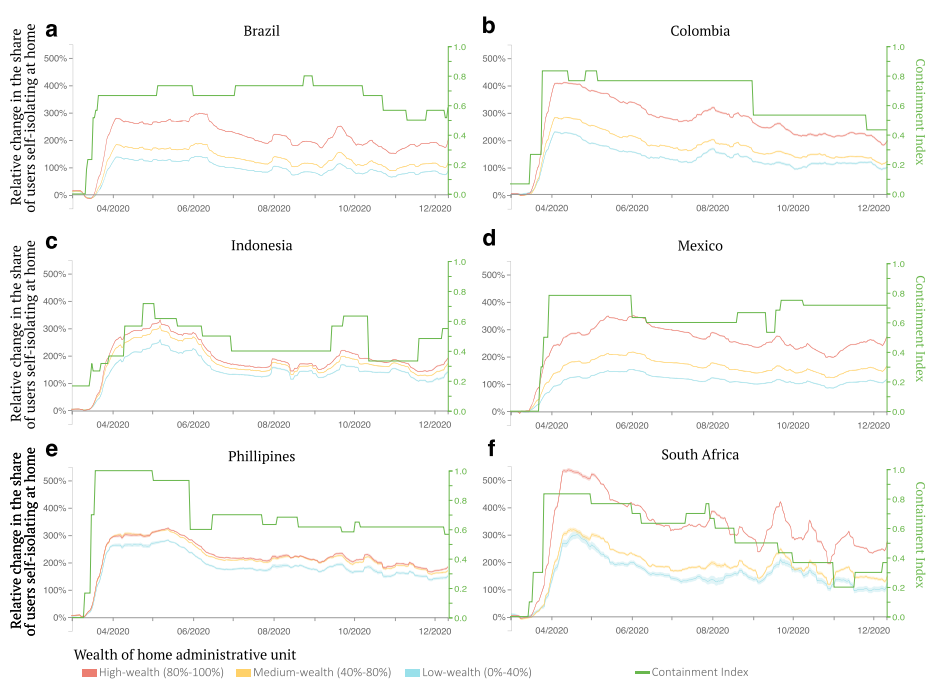
And keep in mind that as the months went by, everyone's mobility slowly started going back to normal, but the gap between rich and poor never closed during all of 2020.
Leaving the city
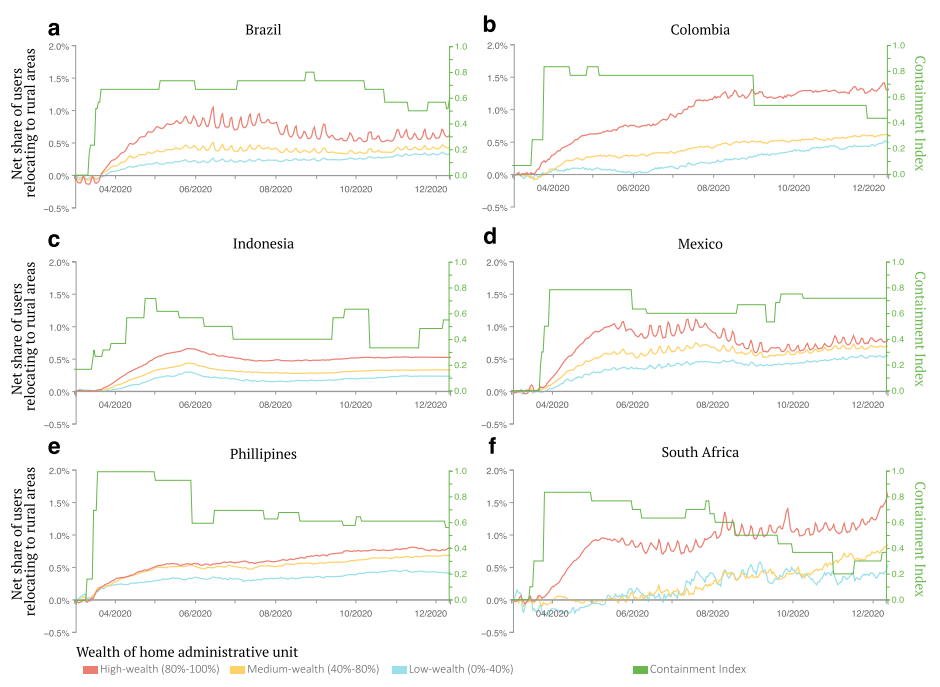
Something else that happened was that lots of people left the cities for rural areas. In the first three months of the pandemic, people from rich neighborhoods moved to the countryside at a rate 49 percentage points higher than people from neighborhoods with fewer resources. The biggest gap was in South Africa, with 80 points, and the smallest in the Philippines, with 27. This looks a lot like what happened in rich countries like the United States, where people with more resources also fled the cities.
Who stopped going to work?
This part seems to me the most important one. People from rich neighborhoods stopped going to work at a rate 30 percentage points higher than people from neighborhoods with fewer resources, and the country with the biggest gap was Mexico, with 43 points. But the most interesting part came when we looked only at people living in neighborhoods with fewer resources and split them by where they worked before the pandemic. Those who worked in rich neighborhoods stopped going to work 37 percentage points more than those who worked in neighborhoods with fewer resources.
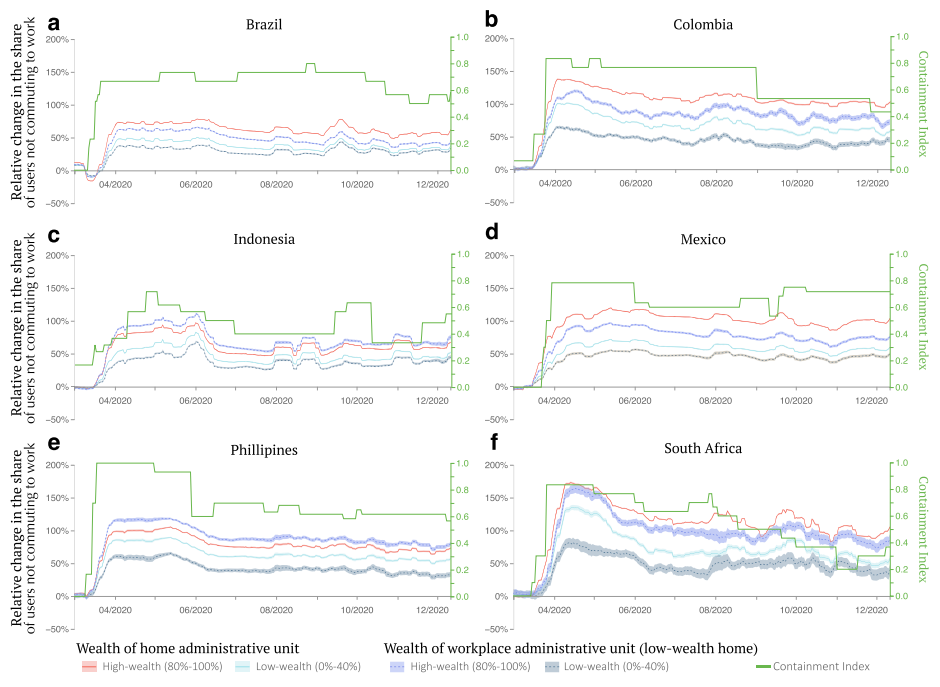
Why does this happen? One possible explanation is that when people from rich neighborhoods stayed home or left the city, they stopped going to the restaurants, shops, and services in their area, and the people who worked there were left without work. And since people from neighborhoods with fewer resources can hardly work from home, the fact that they stopped going to work is a pretty strong sign that they lost their income, although with our data we can't know it for sure.
When public transit shut down
We also wanted to see how government measures were related to these changes. Most measures were applied across the whole country at the same time, without looking at who lived where. We found that public transit closures went hand in hand with more people stopping going to work, but only for people from neighborhoods with fewer resources who worked in rich neighborhoods. For those who worked close to home we didn't find that effect. This makes a lot of sense when you see that precisely the people who live in neighborhoods with fewer resources and work in rich neighborhoods are the ones making the longest trips, and many times they depend on public transit to get there.
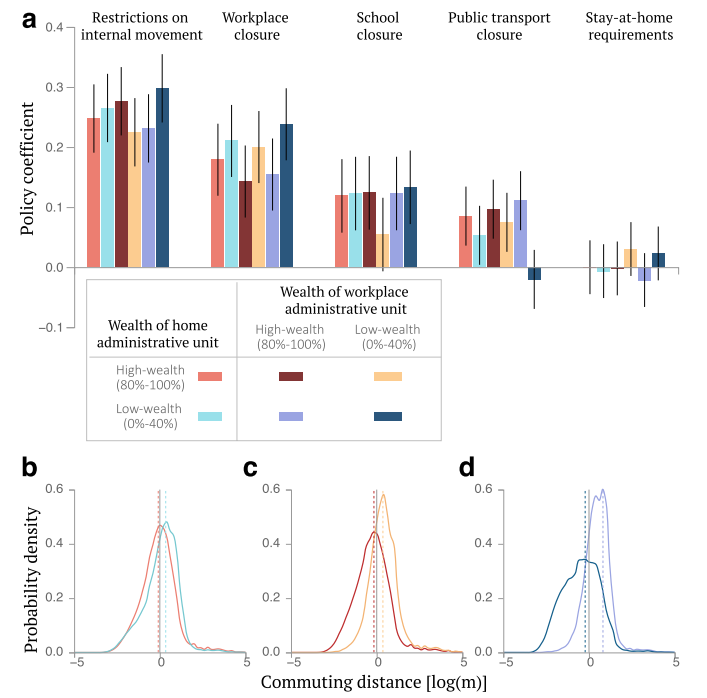
Something to keep in mind is that we gave each person the average wealth of their neighborhood, and not their real wealth. Also, this data has many more users from rich neighborhoods than from poor ones (people from rich neighborhoods are around 45% of the users, even though they are only 20% of the population), so we had to correct for that when building the groups.
So what is this useful for?
For me the most important lesson is that measures applied the same way to everyone don't hit everyone the same way. Shutting down transit or asking people to stay home makes all the sense in the world to slow down an epidemic, but if we don't think about who can follow those measures and who can't, we end up putting the cost on the people with the fewest resources. The good news is that phone data can help us identify the most vulnerable groups and areas very quickly, right when there's no time to run surveys, and that way design support targeted to those areas. Hopefully by the next emergency we'll have this in mind from the very beginning.
Paper: Lucchini, L., Langle-Chimal, O. D., Candeago, L., Melito, L., Chunet, A., Montfort, A., Lepri, B., Lozano-Gracia, N., and Fraiberger, S. P. (2025). "Socioeconomic disparities in mobility behavior during the COVID-19 pandemic in developing countries." EPJ Data Science, 14, 25.