TLDR;
Self-isolation works for controlling the spread of a viral disease. The high mobility we're used to means we come into contact with (or get close to) a lot more people we know, plus a bunch of random people while we're commuting. This larger number of contacts, and how random they are, has a huge impact on containing an epidemic.The song for this post:
This blog post is heavily inspired by this TED talk by Alanna Shaik
I should also point out that I'm not an epidemiologist at all, but I've taken classes with and worked alongside some of them, and they're very well known in their field. Here are their Twitter accounts: Laurent Hébert-Dufresne, Samuel V. Scarpino, Vittoria Colizza, Ben Althouse, and in Spanish Jesús Gomez-Gardeñes. If you have big questions about this, I suggest reading what they write, or reaching out to them if you have a scientific question.
Just to be clear, everything you're about to read here are examples, what we call "toy models," but they're useful for understanding the dynamics of these kinds of systems. I didn't pick anything to make it look more dramatic, and I didn't change anything between simulations. They all have the same parameters.
What is the Coronavirus? And what is COVID-19?
Coronaviruses are a family of zoonotic viruses (they're transmitted between animals and humans). They're called that because they physically have a halo of proteins shaped like a crown. There are different types of them, and in recent years several have become pretty relevant, like MERS (Middle East Respiratory Syndrome), SARS (Severe Acute Respiratory Syndrome), and now COVID-19 (Coronavirus Disease 2019). The origin of this last one was traced back to a wet market in the city of Wuhan, China (you probably already knew this), and the infection probably came from a bat or a pangolin. It hasn't been determined yet, but bats seem to be in the lead, since a type of coronavirus was found in them that shares 96% of its genetic material with the one found in humans. Speaking of that link to the coronavirus genome paper, it's worth mentioning that several scientific journals that usually charge to read their articles have made the ones related to COVID-19 free for a while (I'm against paywalled journals, but at least...).
What are the symptoms?
COVID-19 in particular typically causes mild to moderate respiratory symptoms, very similar to the flu, such as:
- Cough
- Fever
- Shortness of breath
A big problem is that symptoms can show up more than two weeks after catching the virus. In the meantime, people who don't have symptoms but are carriers are potentially infecting others (this is still being studied). Most infected people recover on their own, but there are a number of vulnerable people, like older adults, people with obesity, diabetes, respiratory diseases, etc., for whom it causes complications and who need to be treated in hospitals.
By now we all know that the fatality rate goes up with a person's age (click the image to read the Vox article)
:format(webp):no_upscale()/cdn.vox-cdn.com/uploads/chorus_asset/file/19788829/estimate_case_fatality_hubei_age.jpg)
This is because of the preexisting conditions I mentioned before, and the immune system tends to weaken with age.
Like I said earlier, in most cases the symptoms are mild and less than 5% are critical
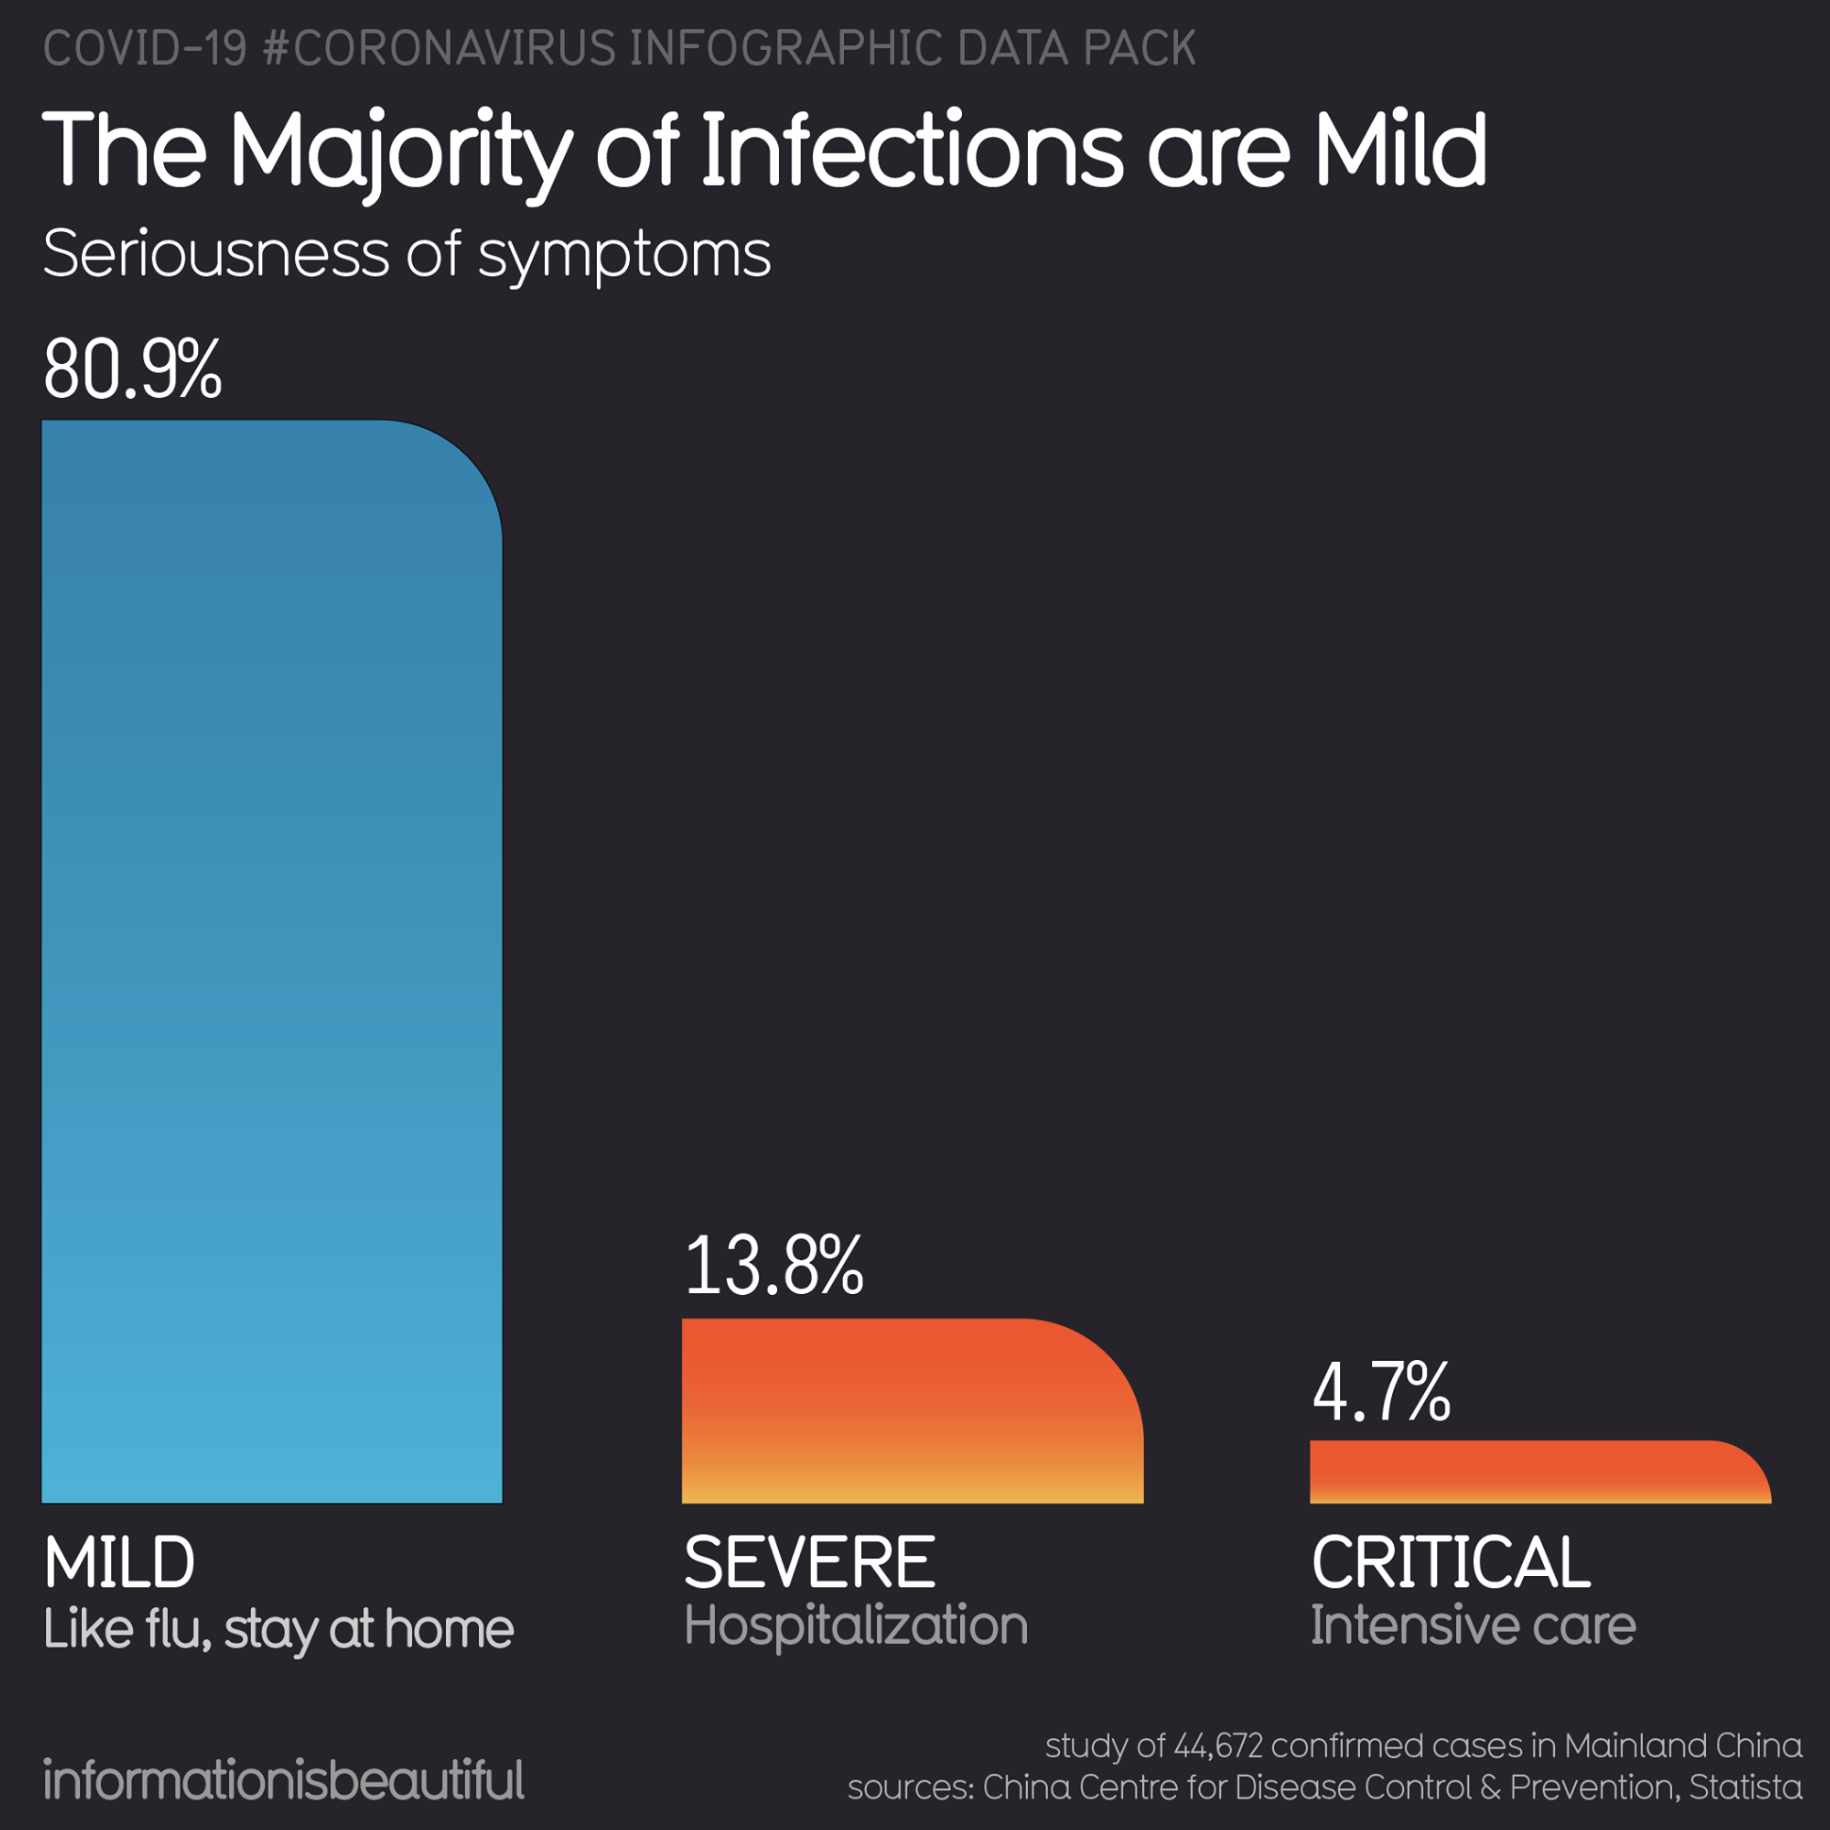
So we need to stay calm right now, this doesn't seem to be the pandemic that's going to wipe us out. But it's super important to take preventive measures:
- Avoid contact with others
- Cover your mouth when you cough or sneeze (with your elbow, please)
- Don't travel when you're sick
- Wash your hands well
- Clean and disinfect the things we touch regularly (doorknobs, phone, table, computer, light switches...)
Infections happen when we breathe in what others cough or sneeze, and the virus stays alive for around 9 days on surfaces. So when we touch infected objects and then touch our face, we might be infecting ourselves.
I'm young and healthy, I'm going to keep living my normal life since I'm not at risk
You might think this way, but that just shows your lack of empathy. It might just feel like a nasty cold to you, but how many vulnerable people do you spend time with? And beyond that, how many vulnerable people do you and the people around you spend time with?
If a lot of people get infected at the same time, health systems will be overwhelmed and there won't be an efficient response for every case, which would increase the fatality rate. That's why it's important to act NOW. We absolutely have to flatten the curve.
What do you mean, flatten the curve?
By the curve we mean the number of people who need medical care over time. Let's think about a situation where the total number of people who will need medical care is fixed. For example, no matter what measures are taken, 100 people will need to be admitted to the hospital within 10 days. But if nothing is done early, 80 of them will need it on the second day, while with containment measures the peak is 20 on the fourth day. It might not sound like a big deal, since 100 people will need medical care either way, but let's say the hospital can only admit 50 people at a time. In the first scenario, 30 vulnerable people don't get treated, and in the second one everyone can get care. Maybe it's easier to understand with the following image.

The orange lines mark treatment capacity. The dotted black line shows the number of people who would need care if no containment measures are taken, and the way the curve shifts shows how the people who need care are spread out over time, depending on how successful the preventive measures are. The purple part shows the untreated cases (and so, high mortality), compared to the green area, which is the treated cases.
OK, so how do we flatten the curve?
Maybe we've already heard the term R0 in this context and we know it's a number between 2 and 3 for COVID-19, but we're not really sure what it means. In basic terms, it tells us that each infected person will, on average, infect R0 people. So if R0 is 3, each infected person will on average infect three others. To contain the spread we need to get R0 below 1, meaning that on average one person doesn't infect more than one other person.
Social distancing. I know, it sounds awful and we don't like it (some of us don't mind). But the best way to contain this is to stay as isolated as possible, for as long as it takes until the disease starts to recede. It doesn't sound great, but it's what we've got. In Mexico, for example, with the medicine shortages we already have, people who need medical care being left on their own, and the elimination of Seguro Popular without putting any replacement in place, we definitely can't afford to test how much our health sector can handle.
Empirical evidence suggests that the best way to act is "bottom-up," meaning that we as a society organize ourselves to take social distancing measures like working from home, avoiding huge concerts (wink wink VL2020), basically anything within our power to reduce our daily contacts. In contrast, the "top-down" way is when the government takes mandatory measures, putting people in quarantine or closing highways. Even though these sound like good containment measures, they might not be. If a person wants to avoid the risk of being quarantined, they very likely won't tell anyone they're sick. And if we close off transportation routes, people will keep traveling anyway, but in ways that make routes harder to track, which can lead to new outbreaks.
OK Ollin, just show me the simulations already... I can read all that somewhere else...
Fine, but first let's talk about the most basic epidemiological model:
SI Model: Susceptible-Infected
Just like the name says, it's a model with two types of individuals. The susceptible ones, who can get sick, and the infected ones, who have caught the disease. Kind of like the saying: "There are two types of cyclists, the ones who've already fallen and the ones who are going to fall." This model helps us see how fast a population will become completely infected.
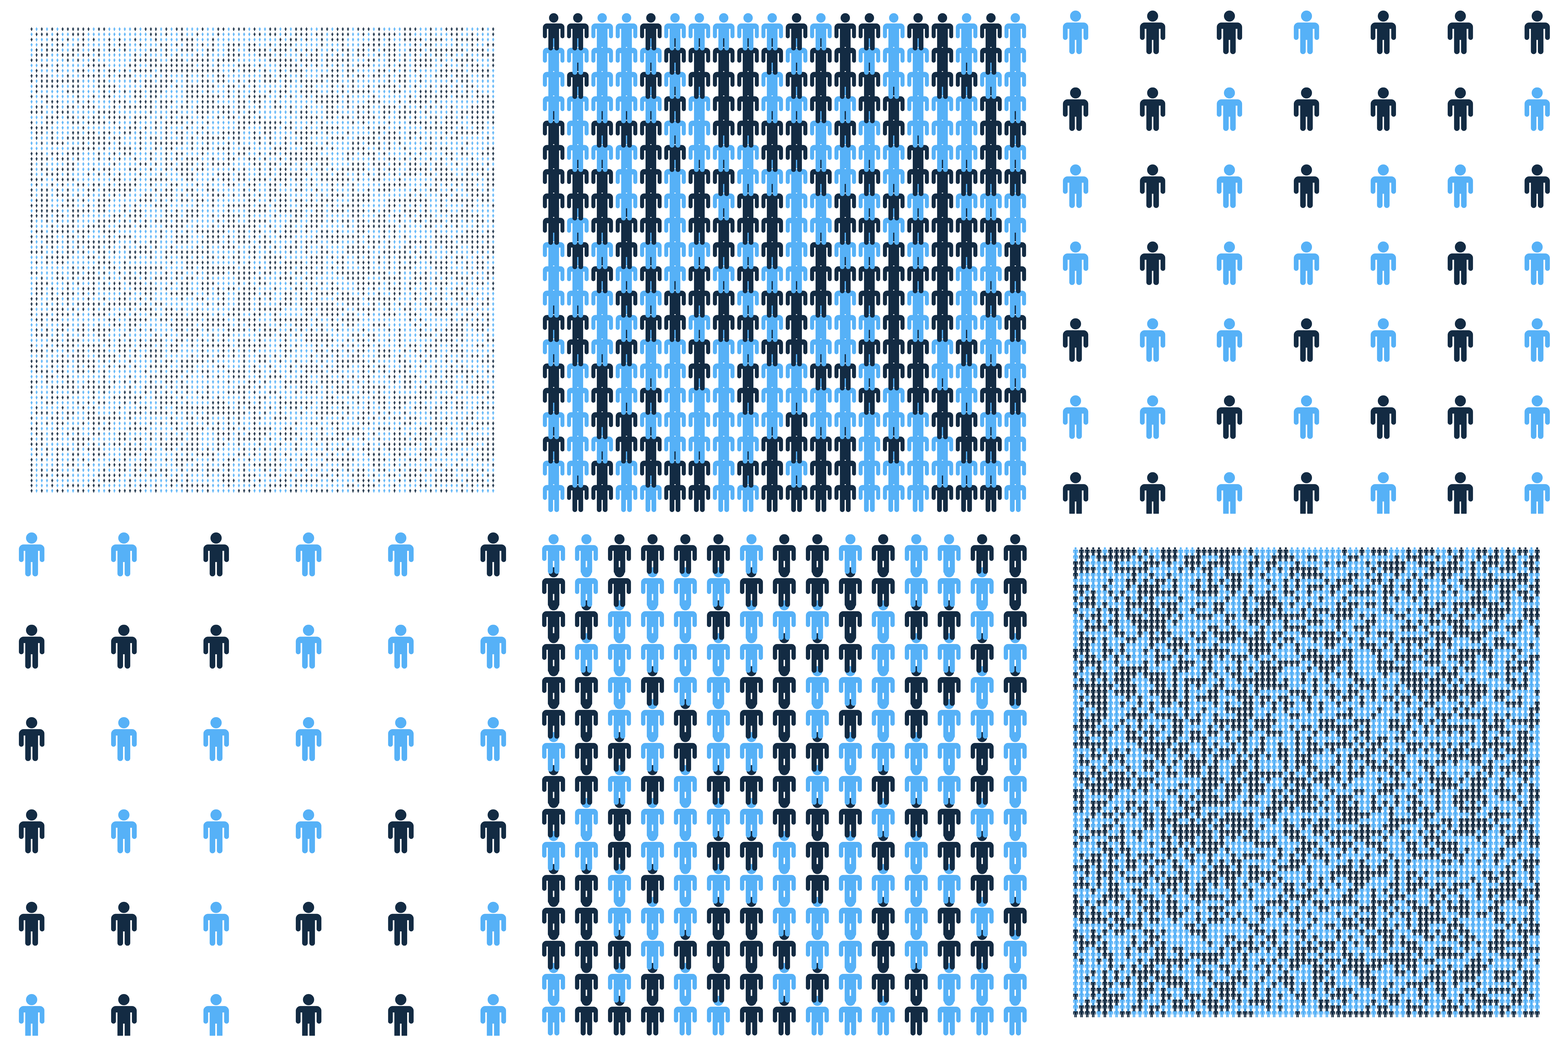
Remember the image I opened this blog with
Using it, let's imagine we have people in the two states (susceptible and infected) and that each infected person can infect their neighbors (since they're in contact) with a certain probability. Something like this:
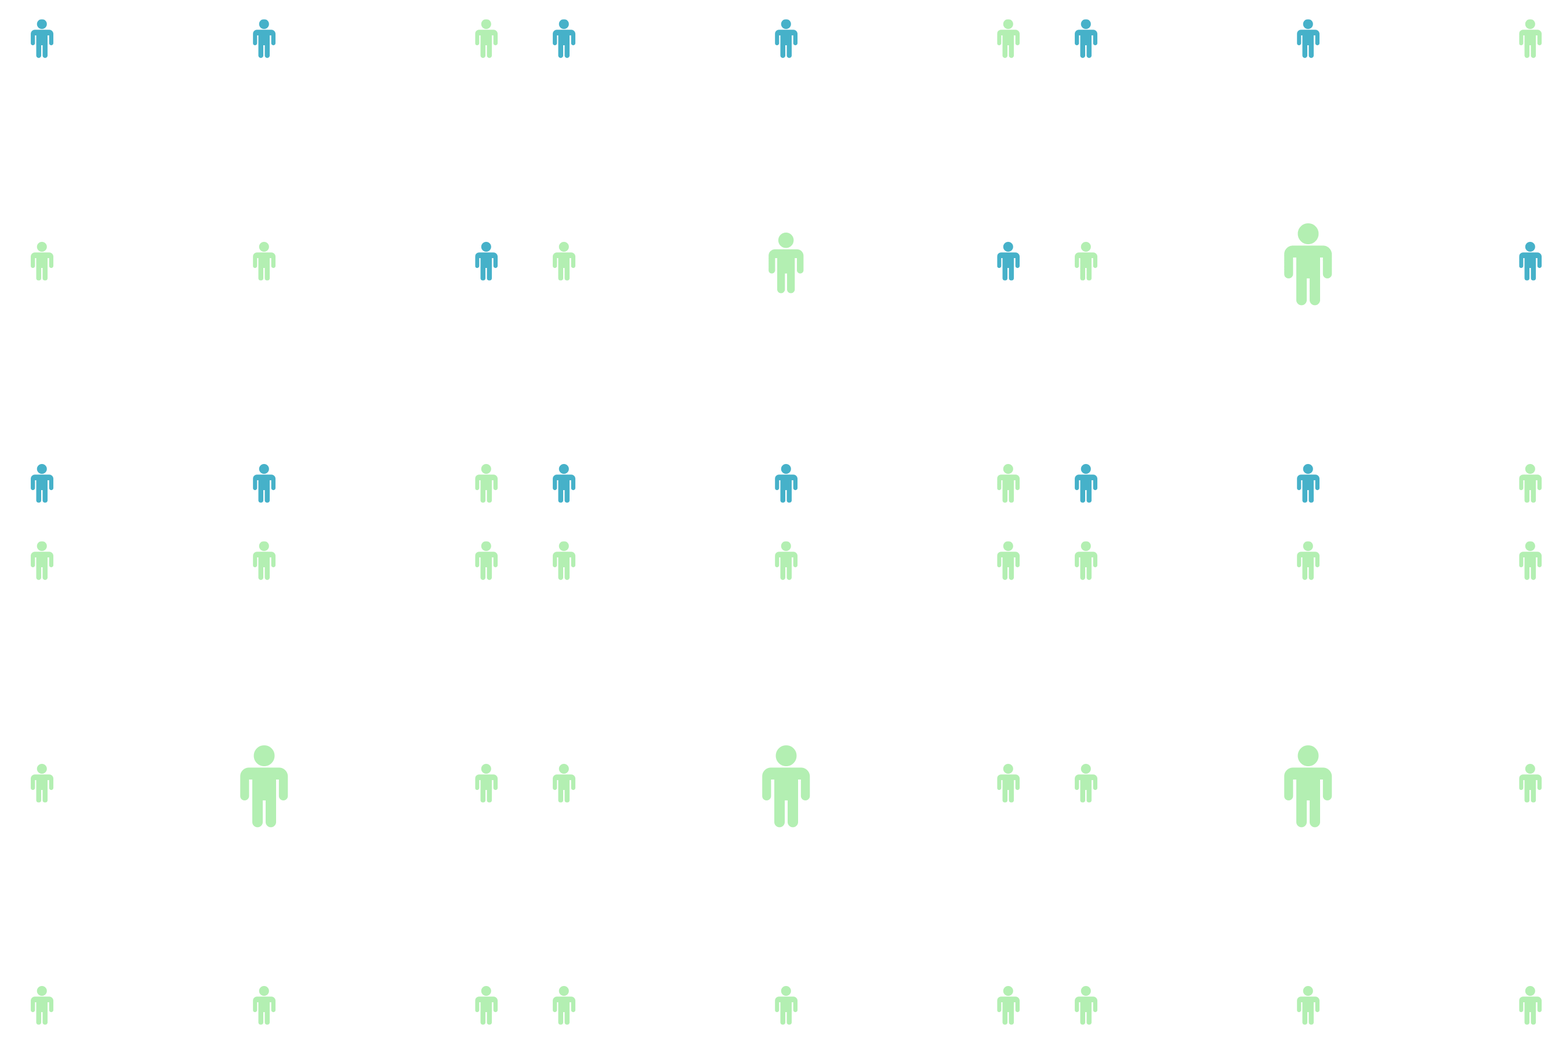
So let's say we have a population of 40,000 people who live on a grid like the one shown and don't move at all. That means they're always in contact with the same people. This population suddenly has 4 cases of COVID-19, and each infected person infects between 1 and 3 of their neighbors with a probability of just 1%. Let's see what the dynamics would look like over 1000 iterations:
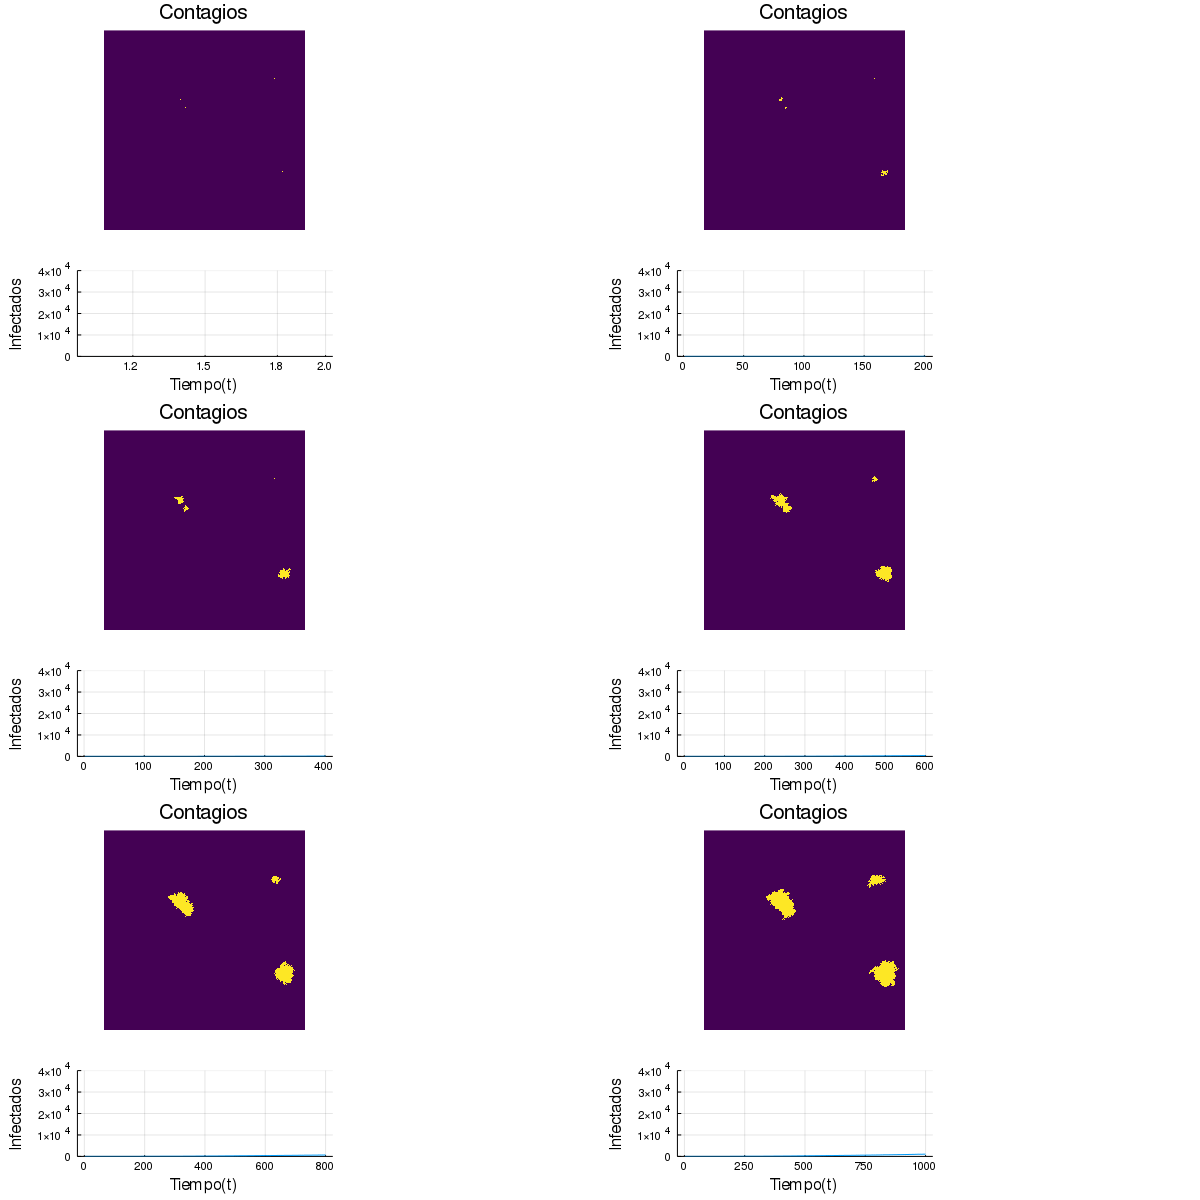
We can see that the infected population starts to grow and clusters of infected people form, although there's no exponential growth. Now let's think about how that's not what our days usually look like. Generally we're in at least two different places, it could be home and school, or work, or the gym, or whatever you want. So we can run a simulation identical to the previous one, but where the same people are in two different spots over time. In other words, on the grid we start in a fixed place, then each person changes places, so they'll have different neighbors, and then they go back to their original spot. This way we simulate being at home, then at work, then at home, then at work, and so on every 150 iterations until we reach 1000.
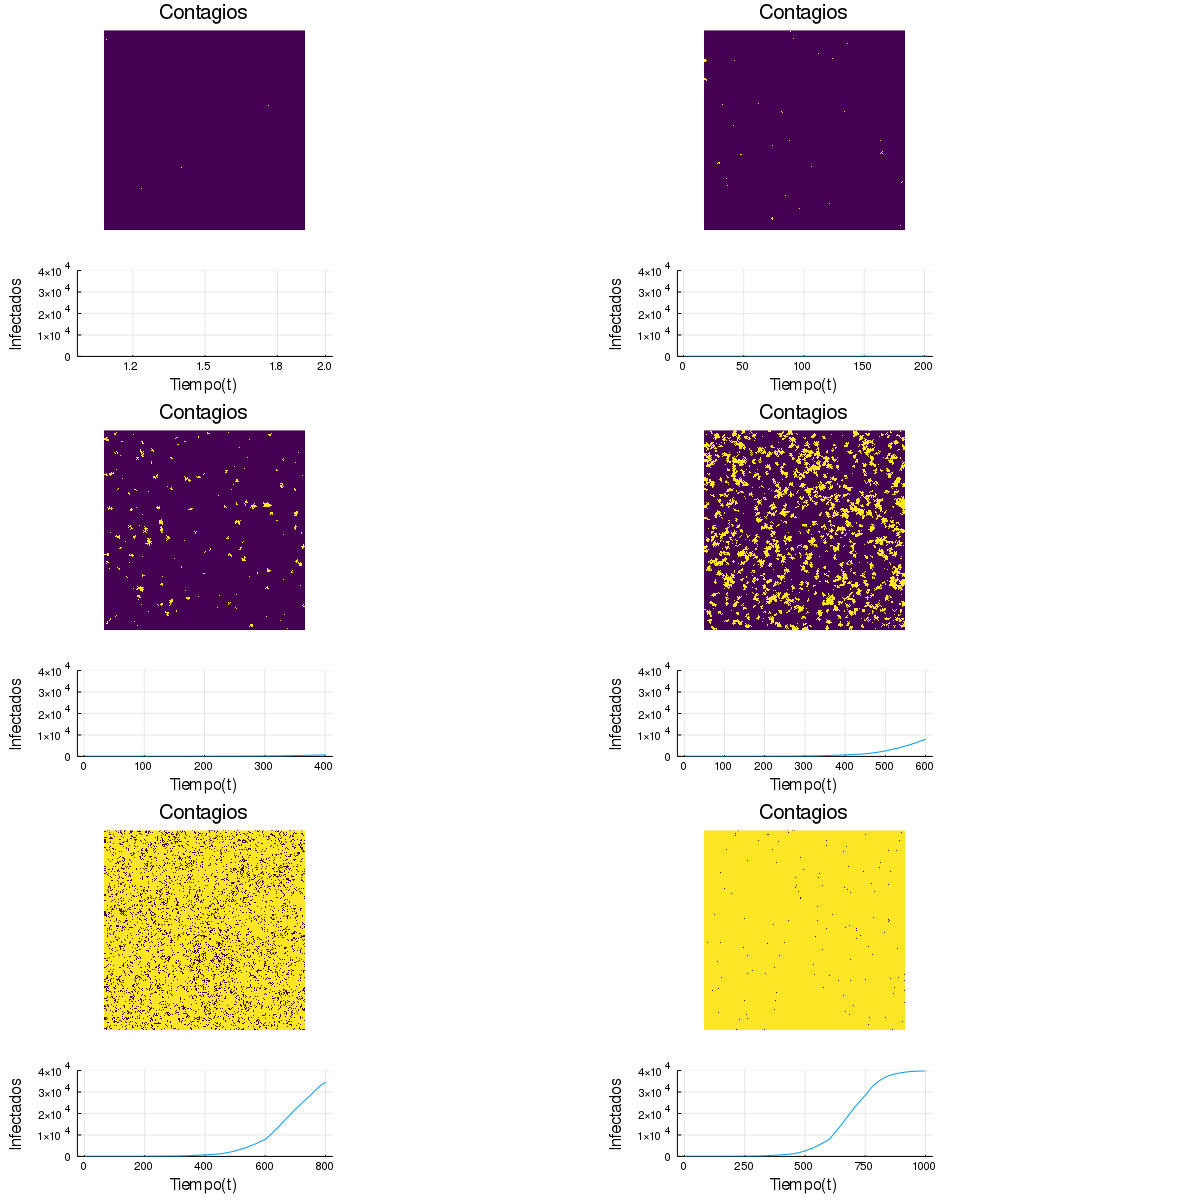
Now we can see that the number of infected people got close to the whole population in the same 1000 steps as the previous simulation. Nothing changed in the parameters. The only difference is that every 150 steps we switch neighbors back and forth, always going back to the same spots. We notice that around step 800 there's an inflection point, which is our saturation point.
We can get even fancier and think about how those aren't our only contacts during the day. We ride the subway, the combi, and/or the bus, and who knows who we'll end up next to. Even more, we don't know who's touched the handrail we're holding onto over the last 9 days. So we have a set of random contacts during our day. We model it as fixed position 1, random contacts for a short period, fixed position 2, random contacts again, back to fixed position 1, and we keep cycling like that until we reach 1000 steps.
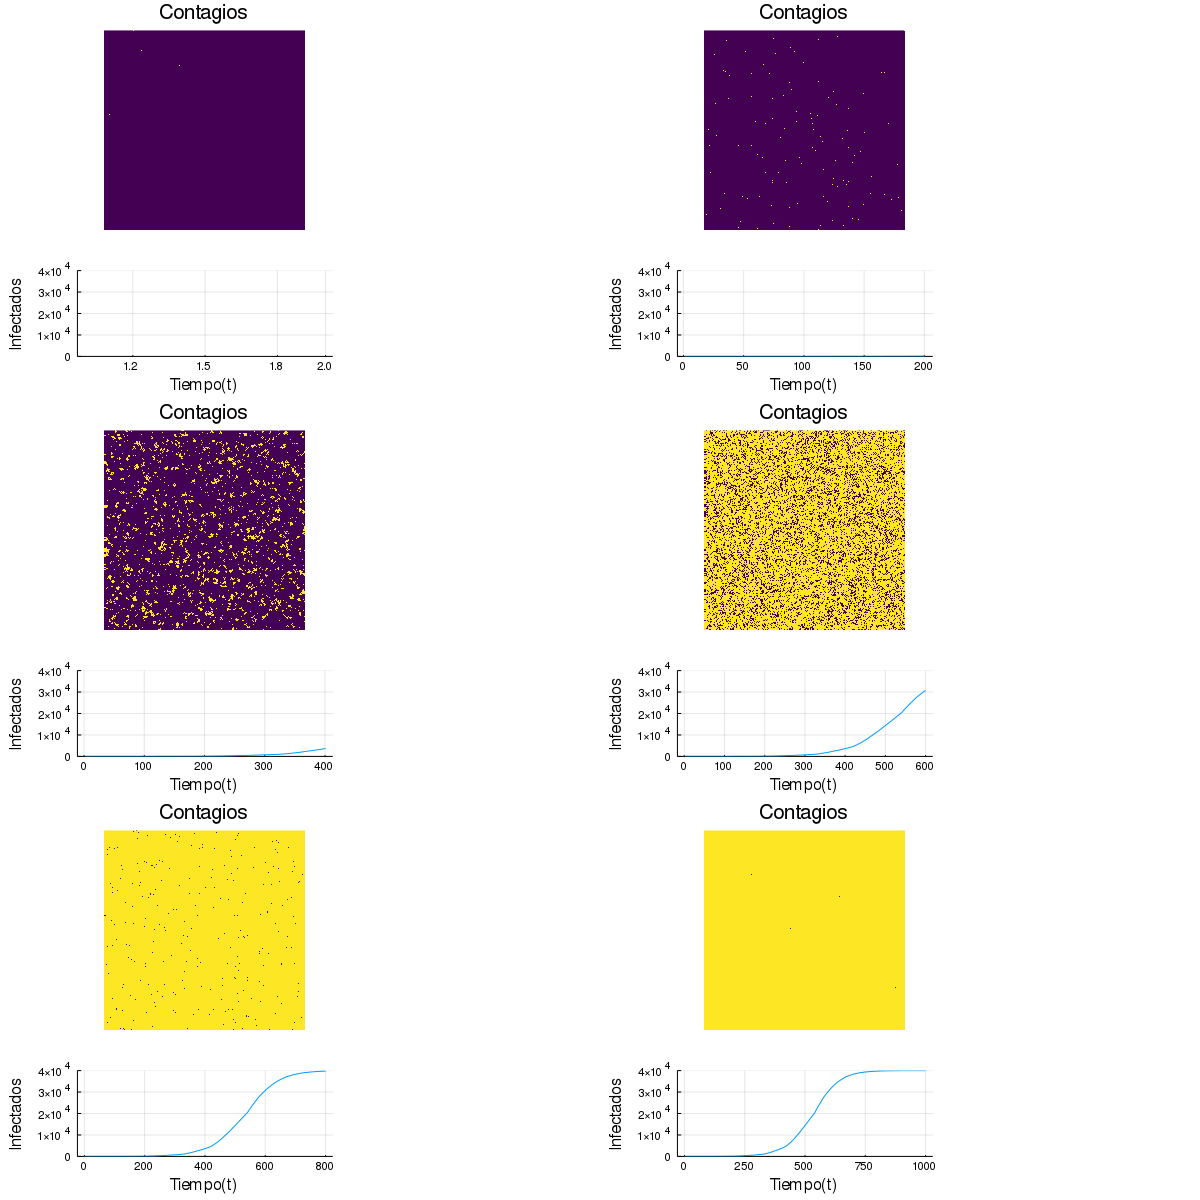
Again, we didn't change anything except the random contacts, and now our saturation point moved to around step 700. In other words, with the same probability of infection, the difference between keeping up our normal personal contacts and taking preventive measures like social distancing has a huge influence on how fast the infection spreads, and so flattening the curve depends a lot on us.
Ollin, this isn't realistic at all. Plus, people recover, they don't stay sick like with HIV.
Well, I know that already... that's why I told you these were toy models, but they're super useful for understanding how the dynamics of this disease are affected by our own human dynamics.
SIS Model: Susceptible-Infected-Susceptible
This model is slightly more complicated because it takes into account that people recover with a certain probability. There are others like SIR or SIRS, where the other state (R) refers to the recovered, meaning you reach a point where, after recovering from the disease, you can't be infected again, either ever or for a while (like chickenpox or the flu). There have been cases of COVID-19 reinfection within a very short period of time, so I stuck to running SIS simulations.
All the parameters are the same as in the previous models, but now there's a 0.1% probability of recovery at each step. It seems small, but it adds up to be pretty high over time. Let's start with the static model.
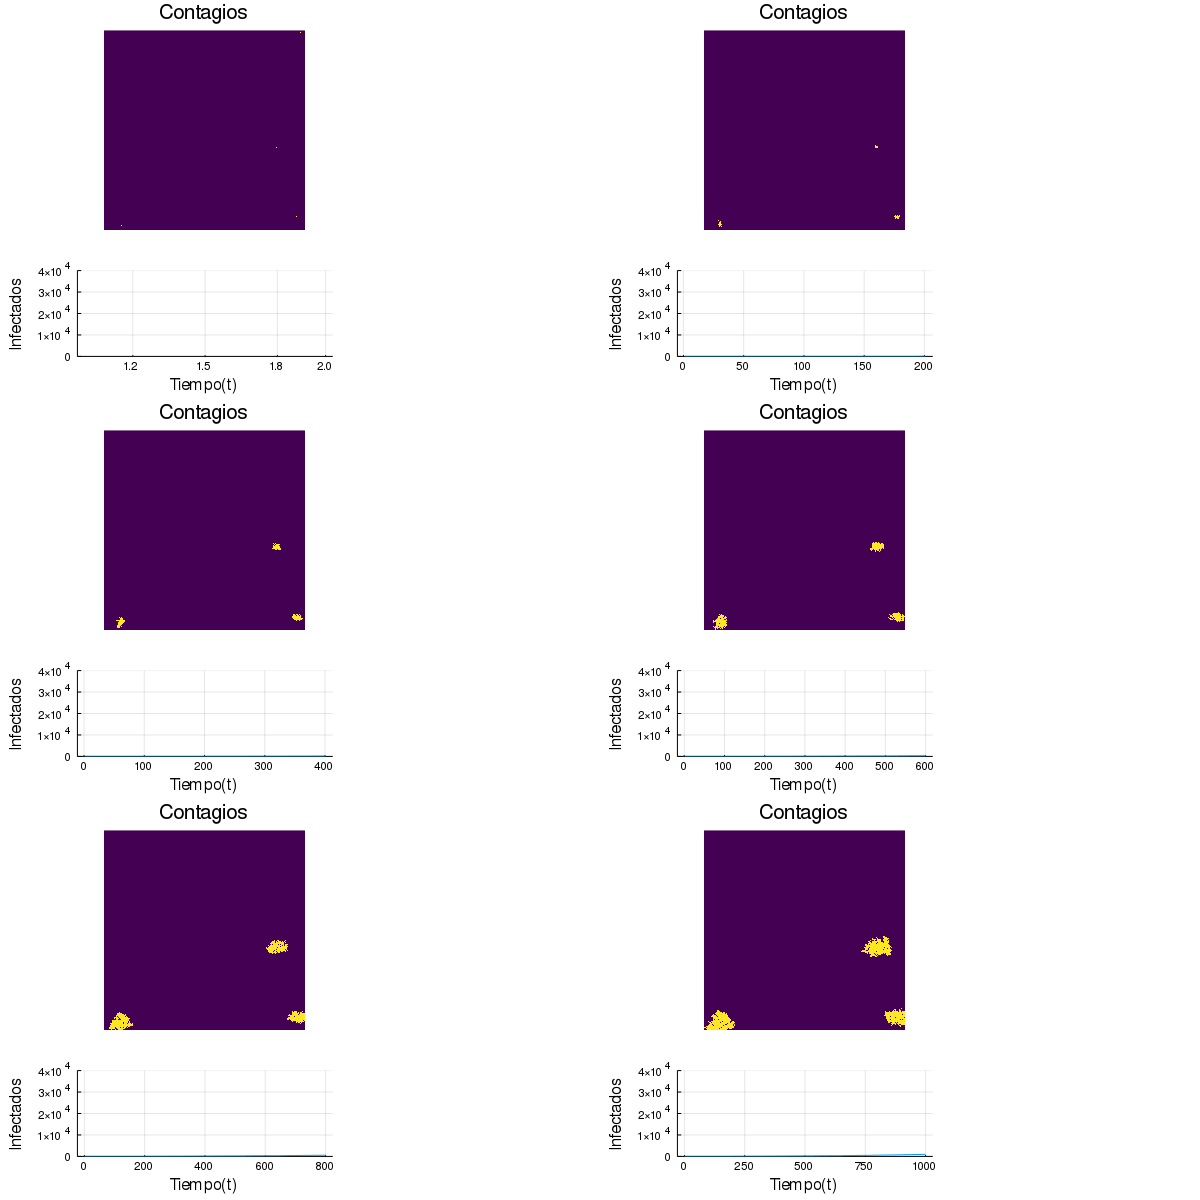
As expected, it's pretty similar to the SI, but the number of infected people is even lower.
Now let's see what happens if the agents can be in two different places.
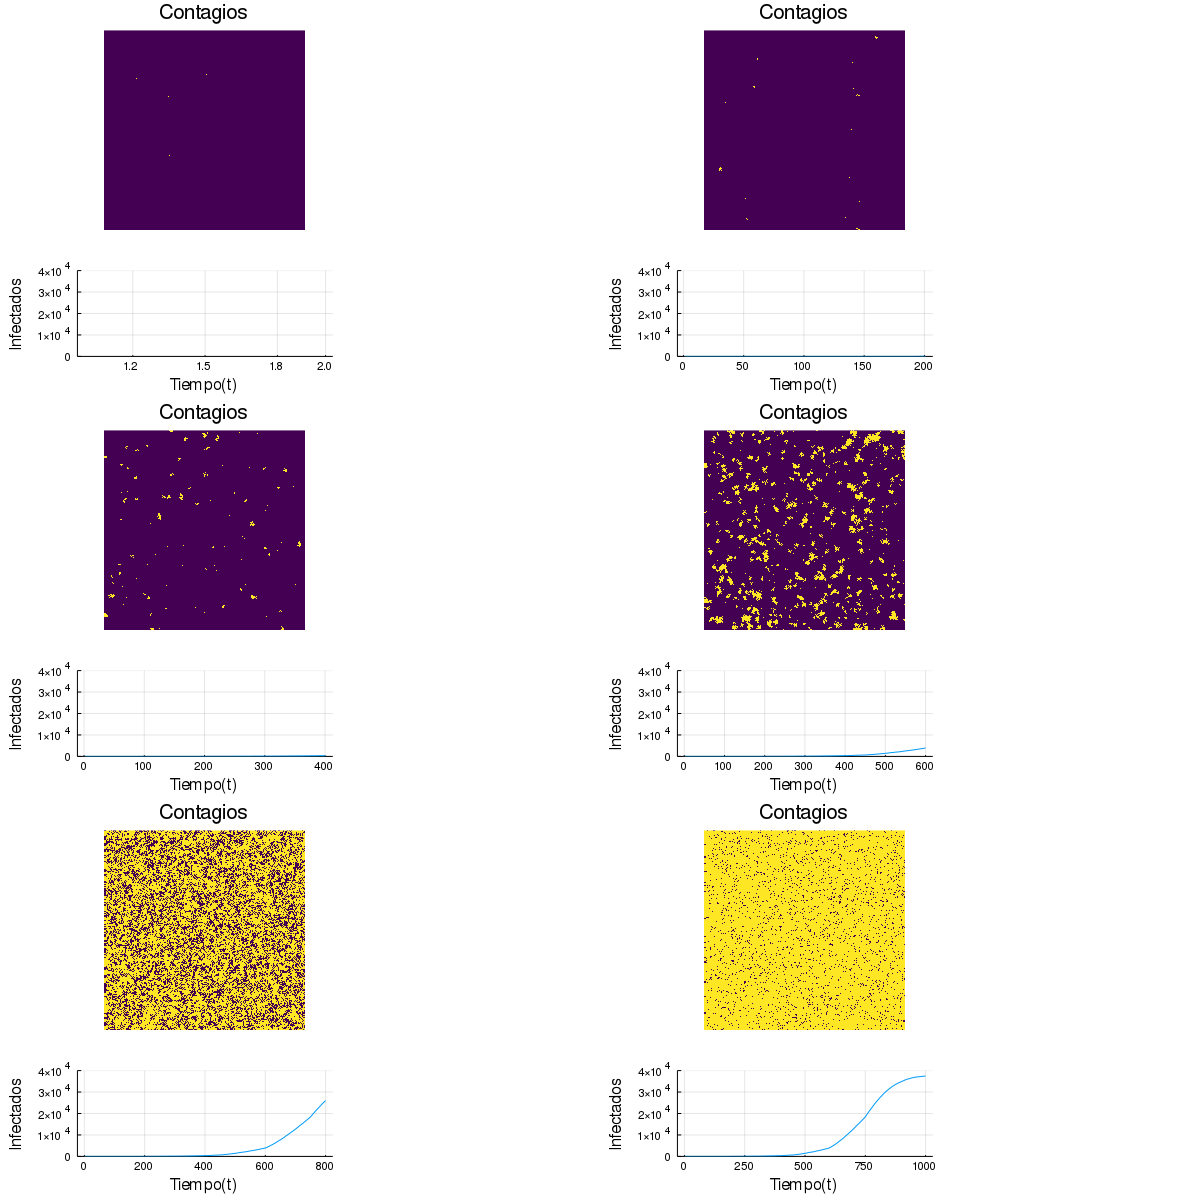
In this new model we do find very different behaviors between the SI and the SIS. As we can see, the infection reaches the exponential phase later and it's less steep than in the SI. This is a really interesting result because it tells us that just having two different sets of interactions leads to a phase change. Now let's see what happens when we come into contact with people randomly for a short period of time. It's worth noting, though, that we don't reach the saturation point until almost the end of the iterations.
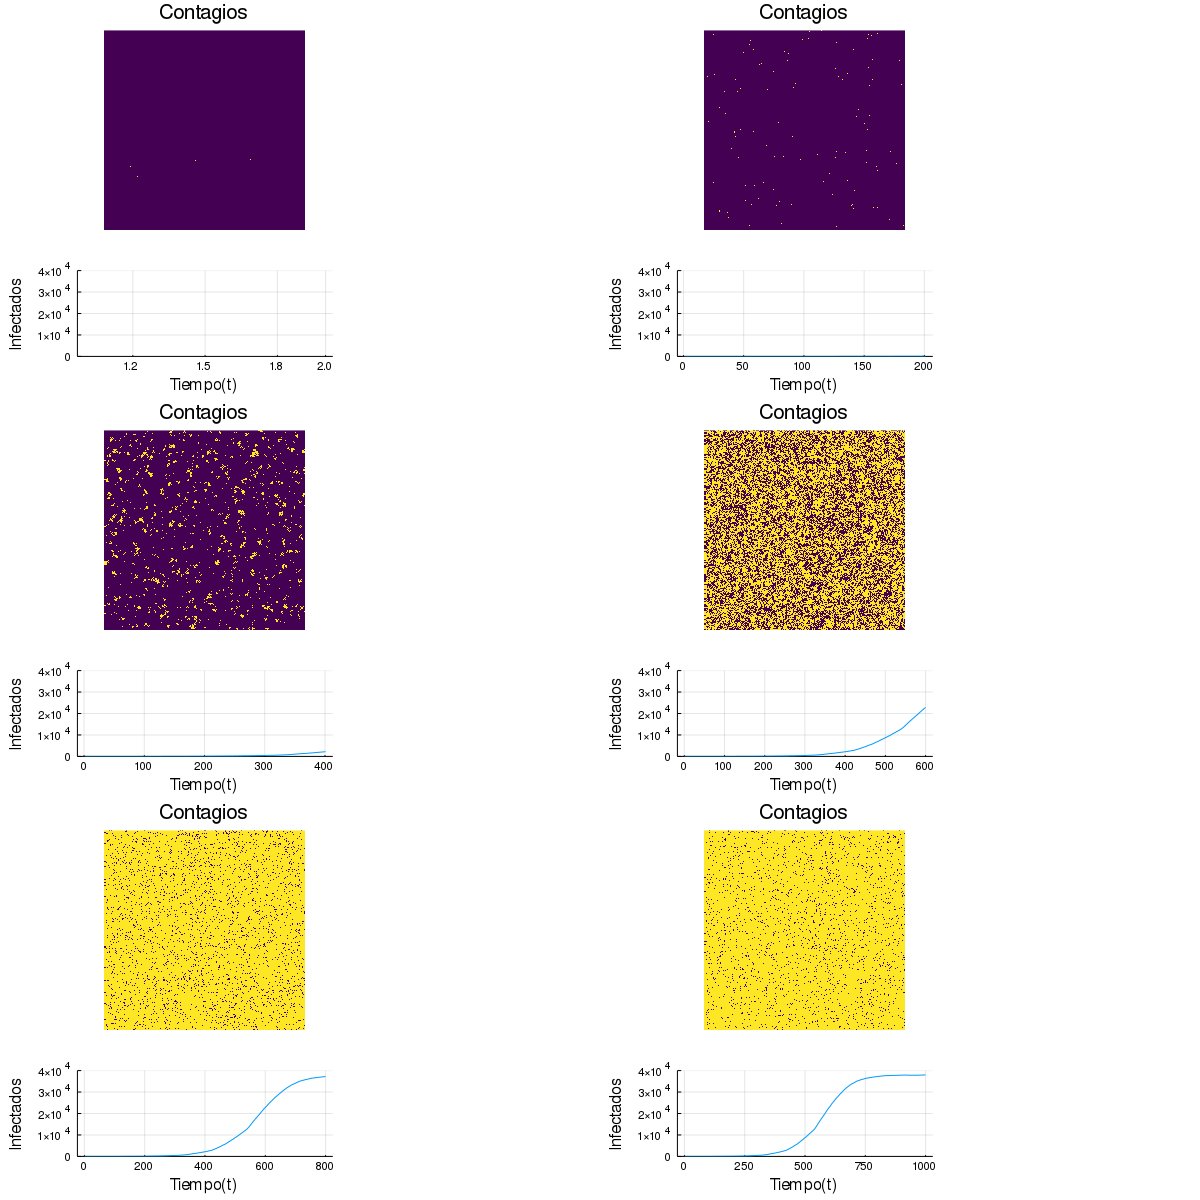
In this model, recovery has practically no effect on the shape of the curve. We only prevent the whole population from being infected at the same time. It's super important to notice that, unlike in the previous model, here we reach the saturation point very quickly, meaning the speed at which the disease spreads is much higher. This is even more surprising if we consider the effect that adding the recovery rate had on the model where we're only in two places (as if we teleported). This result suggests there's a certain critical value where a phase change happens (just like in the Ising model), but we'll leave that exploration for later because it goes beyond the scope of what I want to get across.
SIR Model: Susceptible-Infected-Recovered
Ollin, you talked about flattening the curve but that doesn't show up in these models
Well, for that we need to take into account the fact that people recover, and in general there's a period when recovered people are less susceptible than those who've never been infected. This is due to multiple factors. It could be because they take more precautions, or because their immune system already knows how to handle that virus. So we can create a model where after people get infected, they recover and don't become susceptible again.
For the static case
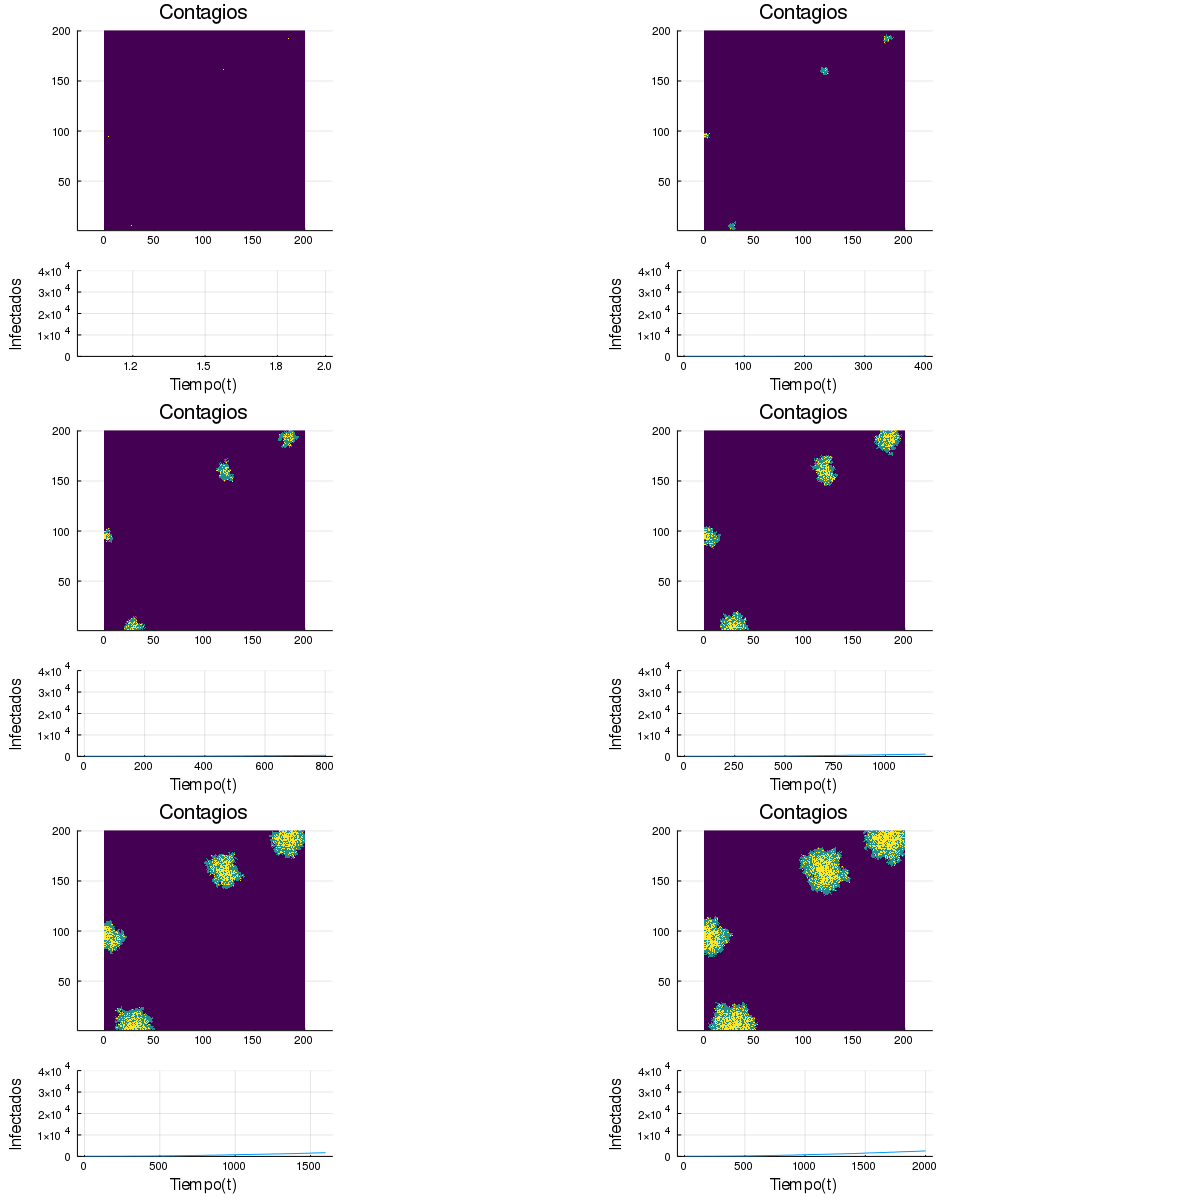
To see a more dramatic example where we really do see a curve with a peak, let's raise the infection rate to 10% and recovery to 1%.
We'll only use these rates for this example, but let's see what happens with the original ones when we switch places.

Notice that the exponential phase kicks in around iteration 600 and reaches the saturation point around 900, with a maximum value slightly above 30,000 infected.
But what happens if we have random contacts in this situation?
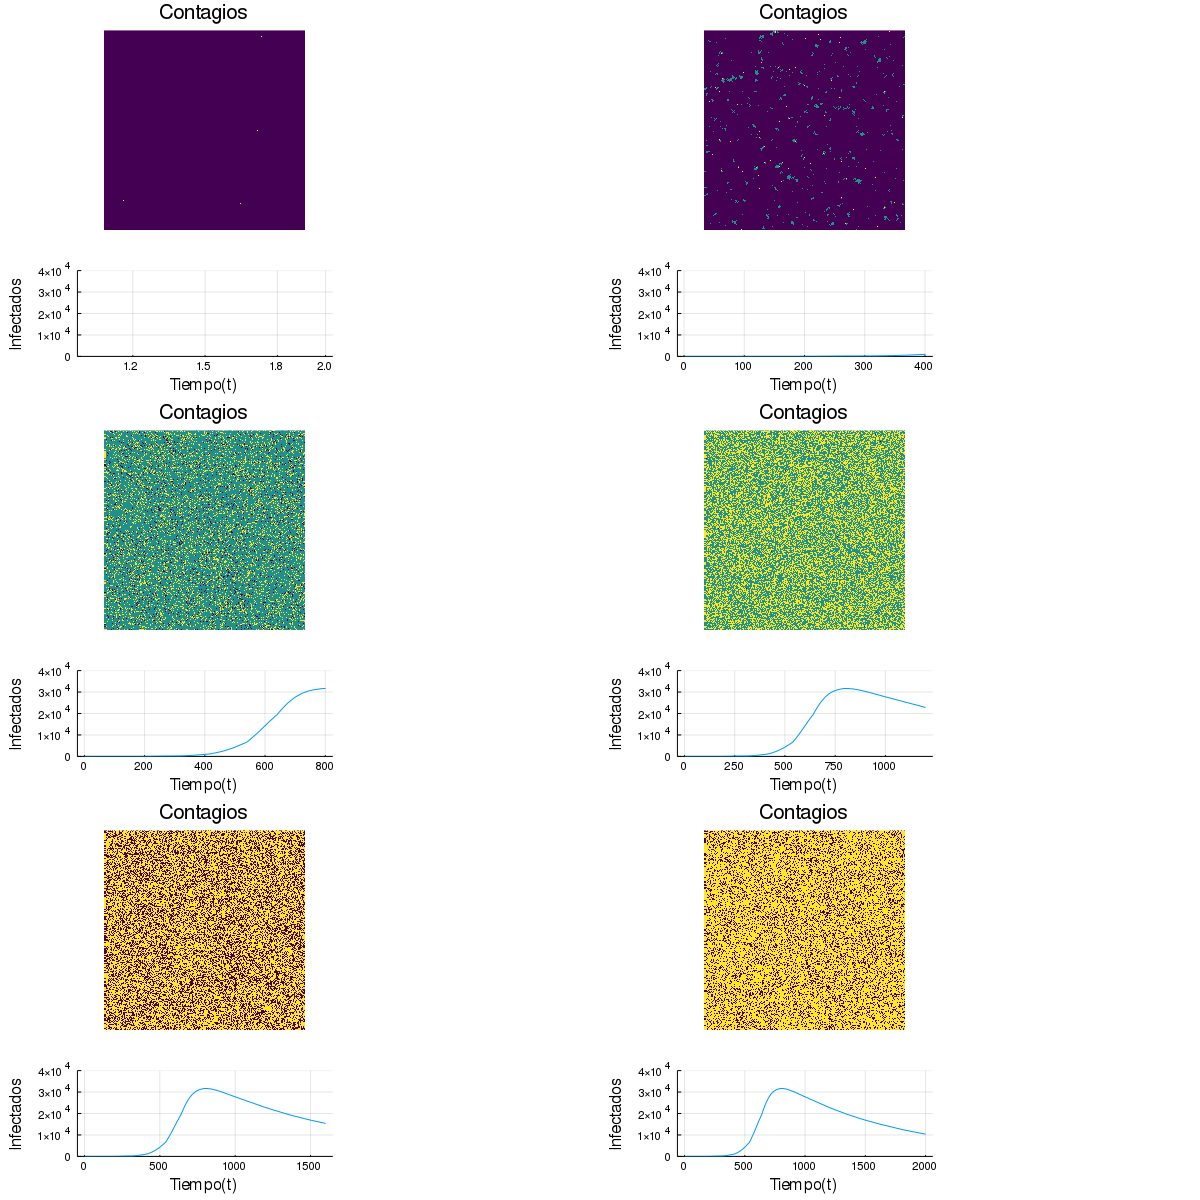
This case is really very similar to the previous model. The biggest difference is that there's a (slightly) higher number of infected people. But the big moral of this story shows up when we compare the curves where there's no movement with the ones where there is. Even with a disease that's 10 times more contagious, we never get more than 10,000 cases if we stay relatively isolated. Plus, the distribution is much less skewed, meaning it isn't concentrated toward one side in time. This lets us give better medical care to all cases than in the models where there are more contacts between individuals.
In conclusion
The takeaway here is really simple: don't take pandemic containment measures lightly. The sooner we act, the better. Don't panic, but for the sake of the people around us, be careful and take the necessary safety measures. If you can work from home, do it. Avoid places where you'd have to be less than two meters away from other people (I know it's hard, since public transportation doesn't work that way). Disinfect everything you touch regularly and wash your hands. Social distancing is the best weapon we have right now. Let's hope vaccines get developed soon, but for now be empathetic and stay alert. Don't go straight to the hospital if you think you're infected. Most countries already have help lines.
Go back over the simulations I showed you and look at the huge difference that minimizing contacts can make. Remember that this is an exercise in empathy, and even if we're not seriously affected, many other people in precarious situations can suffer a lot. For now, love each other from a distance. Be good to each other.
If you're reading this and there's more you'd like to add, please write to me. Also, if you can and want to, you can leave comments down below. Remember, I'm not an expert, but I'm interested in the topic.